In every network or strategy meeting, the same question comes up:
“How do we really compare to other airlines?”
But too often, benchmarking answers the wrong question because it assumes every airline has the same opportunity to apply a fuel-efficiency initiative on every flight. In reality, success rate depends on applicability, and applicability depends on constraints.
For many airlines, especially large hub operators, those constraints are non-negotiable:
- Air Traffic Management (ATM) constraints that prevent the intended profile from being flown.
- Airport and ground constraints that restrict the procedure (taxi distance, local rules, performance limits).
- Weather and operating conditions that invalidate assumptions (visibility, wind, OAT limits).
- NOTAM restrictions that temporarily override procedures (by airport/time/condition).
If you benchmark “success rate” without first aligning when an initiative could realistically be used, you don’t get insight; instead you get misleading comparisons.
The Real Problem: “Apple-to-Apple” Benchmarking Requires Applicability
Two airlines can report the same initiative, the same fleet type, and operate in the same region and still not be truly comparable.
Let’s dig into a real-world example to see why. Keep in mind this is just one illustrative case: each initiative has its own applicability criteria, so benchmarking must be configured accordingly.
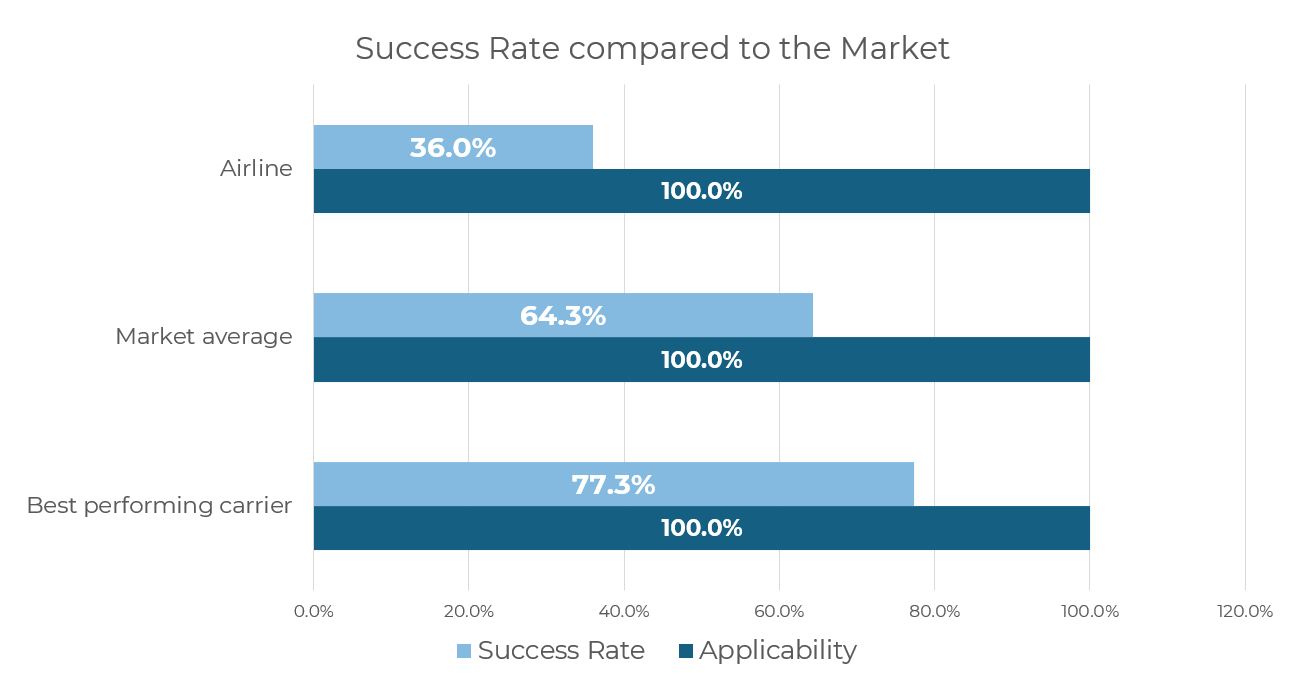
In the benchmark chart above, one customer’s success rate for reduced Air Conditioning Pack usage during taxi is compared against a peer group selected for relevance (similar fleet and/or base region). On the surface, the result looks clear: our airline achieves 36.0%, versus 64.3% for the market average and 77.3% for the best performer.
However, the chart also shows 100% applicability for all carriers and that’s exactly where the comparison can break.
In our airline’s operation, there is a hard procedural constraint driven by hot-climate destinations: ALL PACKS must be ON when outside air temperature (OAT) exceeds 24°C. In other words, a significant share of our taxi phases is not truly applicable for the initiative. So if we benchmark raw success rates without filtering for OAT ≤ 24°C, we’re not measuring real success rate, instead we’re penalising flights where the initiative is procedurally not allowed.
The Solution: Apply Your Applicability Rules to Peer Data
StorkJet’s benchmarking service in FuelPro is built around a principle we don’t see elsewhere: airlines can apply their own applicability logic to pooled peer data. That way, you benchmark only within conditions that are truly valid for your operation.
Using the above reduced PACK during taxi example, once we apply the rule “only benchmark events where OAT ≤ 24°C”, our airline’s true applicability drops below 100% and the comparison becomes genuinely apple-to-apple.
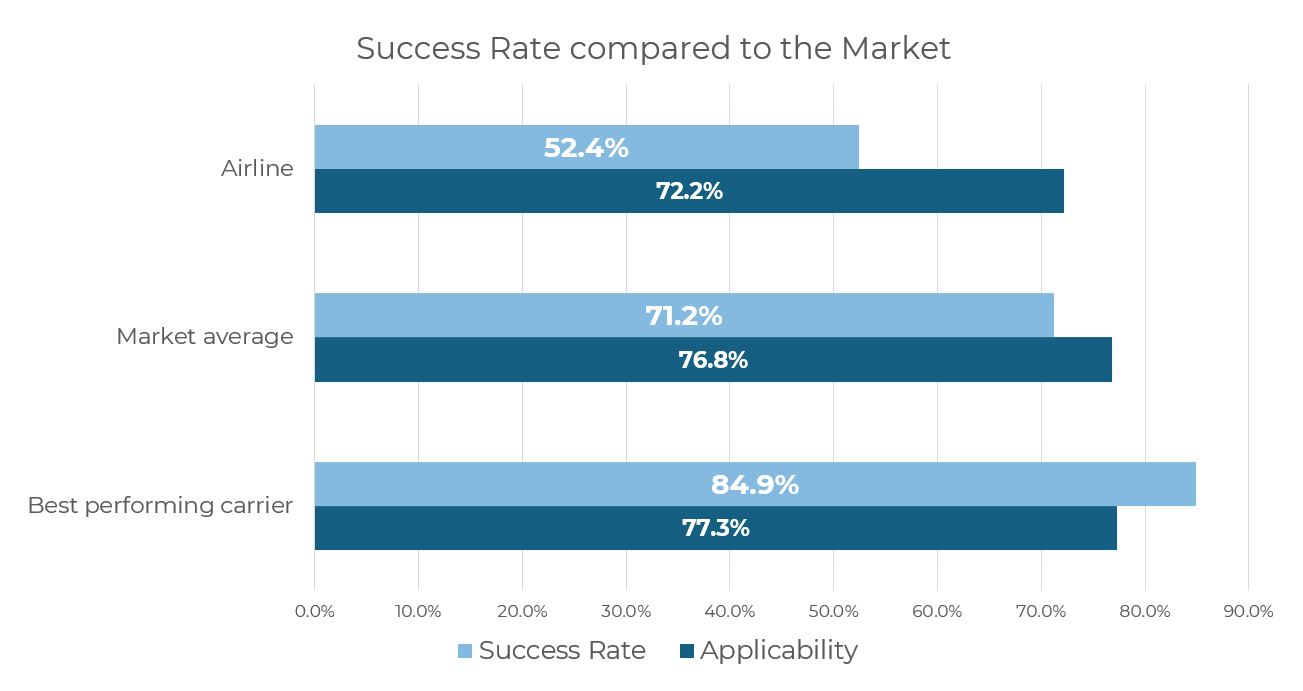
Here, applicability is 72.2% for our airline, versus 76.8% for the market average and 77.3% for the best performer meaning the applicability window is broadly similar across the peer group. Within that comparable window, the success rates deviated from the 100% applicability case; 52.4% for our airline versus 71.2% market average and 84.9% best-in-market.
Importantly, once we apply the filter, the best-vs-us gap narrows from 41.3 percentage points (77.3% − 36.0%) in the unfiltered view to 32.5 percentage points (84.9% − 52.4%). That confirms two things: there is still a real improvement opportunity, but we have successfully removed cases where the initiative was procedurally not allowed, making the benchmark fair and apple-to-apple.
Scale & Structure: The Basis for Reliable Benchmarking
Above approach only becomes powerful with enough data and that’s where StorkJet is strong. FuelPro benchmarking builds on substantial historical volume (1.6 million flights per year), reinforced by multiple participating operators and trials, so peer comparisons remain strong even after applying strict applicability filters.
FuelPro benchmarking also combines scale with consistent structure:
- Standardised metrics: common definitions for applicability and success rate for apple-to-apple comparisons.
- Secure, anonymised peer groups: anonymised pooled data governed under NDAs and modern security controls (ISO-aligned).
- Initiative-level visibility: benchmark specific practices (e.g., APU taxi, SETI, CI strategy, extra fuel policy), not just high-level KPIs.
- Interactive dashboards, always up to date: self-service views highlight trends, outliers, and gaps, refreshed regularly.
Conclusion: Benchmarking without Applicability is Just Noise
If you don’t first define when an initiative is actually allowed and feasible, “success rates” just reflect constraints, weather, and operational complexity, not compliance. Especially, for large hub airlines operating at scale, applicability is crucial, and any benchmark that ignores it is noise.
That’s exactly where SJ’s FuelPro benchmarking stands apart: it lets you apply your own applicability rules to peer data, so comparisons stay truly apple-to-apple. It also shows results with and without your applicability rules, so you can validate the assumptions and challenge the applicability logic if needed. With StorkJet’s volume and structured metrics, you get benchmarks you can actually trust, and act on.
If you’d like to see how your airline compares and where savings can appear from day one reach out to learn more about FuelPro’s benchmarking capabilities.
