Following our previous article, we received a wave of thoughtful feedback and on-the-ground insights from across the industry; line pilots, flight ops and efficiency analysts, network planners, and lessors. Many readers specifically asked how our single-engine-taxi analysis changes once the time cost component is factored in, highlighting that the true benefit (or drawback) of single-engine taxi must be assessed based on the Direct Operating Cost, not fuel burn alone. We value this kind of challenge because it reflects the real questions airlines face – and our role is to listen, explore, and provide solutions that make operations easier.
Direct Operating Cost (DOC) combines time-based and fuel-based expenses, and the Cost Index (CI) simply expresses the relative weight each airline’s own cost structure assigns to time versus fuel. Because the cost structure shifts between ground and in-flight, CI derived from taxi operations is often considered different from the Cost Index that applies in flight. Before we explore those differences, let’s first define what Cost Index really means.
Cost Index (CI) is the ratio that tells the flight management system how to trade time against fuel when choosing speeds:
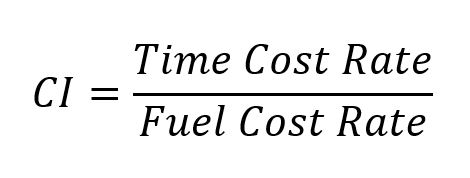
- Time Cost Rate: monetary cost per unit time (e.g., $/min or $/hr). It typically aggregates crew pay/credit, time-based maintenance and utilization, lease/ownership and insurance allocated per block hour, schedule/disruption penalties, curfews/slot risks, and connection value.
- Fuel Cost Rate: monetary cost per unit of fuel (e.g., $/kg or $/lb), i.e., fuel price × burn.
When CI is zero the flight-management system selects the slowest, most fuel-efficient speed, whereas a higher CI signals that time is more valuable, prompting the aircraft to fly faster and accept increased fuel burn.
Significant amount of “time” cost in a CI calculation comes from following sources:
- crew pay and allowances,
- aircraft/engine capital, lease charges and maintenance reserves allocated per different metrics such as block hours, flight hours, cycles, or simply calendar months,
- delay-related penalties such as passenger mis-connections, curfew fines, or recovery costs.
These cost drivers can vary widely from one airline to the next, depending on each carrier’s employee agreements, corporate and ownership structure, and the specific terms negotiated in its aircraft and engine leases.
Consider two extremes to see how the taxi-phase CI swings. In a “low-CI” set-up, crews are paid per sector and distance flown, aircraft leases are fixed monthly rents, and engine reserves are charged only per flight hour; almost nothing new is spent while the aircraft is taxiing, so each additional minute on the ground is nearly “cost-free” and the resulting taxi-phase CI stays low. At the other end, when crews are paid per block hour and the aircraft is on a wet-lease/ACMI contract that also bills by block hour, every minute from pushback to parking triggers both crew pay and lease expense; time suddenly becomes expensive, pushing the taxi-phase CI much higher and making it worthwhile to trade a little extra fuel for quicker ground movement.
Think of Cost Index as a ratio of time cost to fuel cost. Any change in either side of the ratio will shift the result. On the ground, fuel burn is much lower than in flight – a narrow-body may use only 12–17 kg per minute while taxiing, compared with 40–60 kg per minute in cruise. This makes the denominator of the ratio – fuel cost – much smaller during taxi. Even if an airline’s time cost on the ground is lighter – for example, crews are paid per sector and leases are fixed – the smaller fuel cost term can offset that reduction and push the taxi-phase CI close to, or even above, the in-flight CI.
Let’s revisit the two nearly identical Embraer E190 taxi-in segments at Istanbul Airport that we analyzed in the previous article, Flight 1 taxiing on both engines and Flight 2 shutting one engine down 5 minutes after landing, each with virtually the same landing weight and taxi route. Using a Cost Index baseline of 5 kg per minute, we can now examine the momentary direct operating cost (DOC) profiles for these flights: dual-engine taxi versus single-engine taxi.
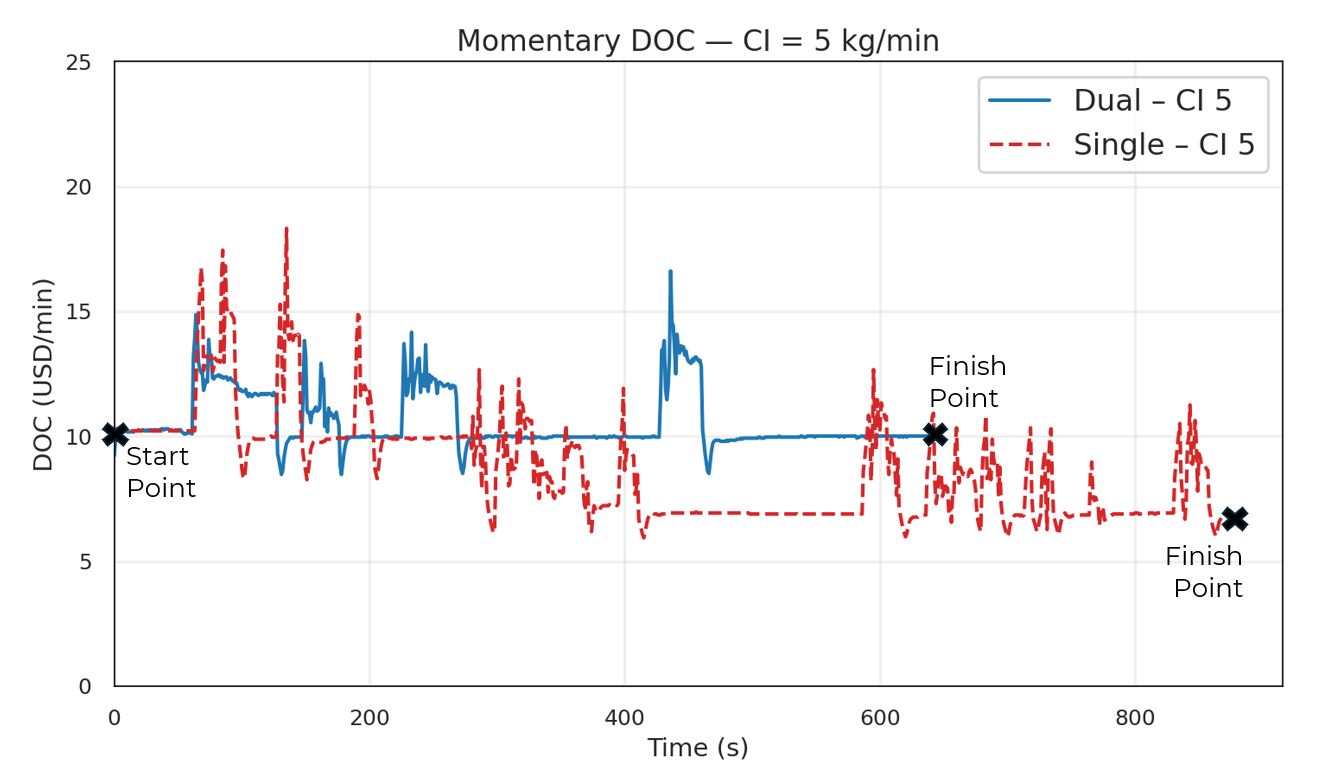
*: Based on 1kg Jet-A fuel = 0.68 USD
Now let’s repeat the analysis using CI=15 kg/min.
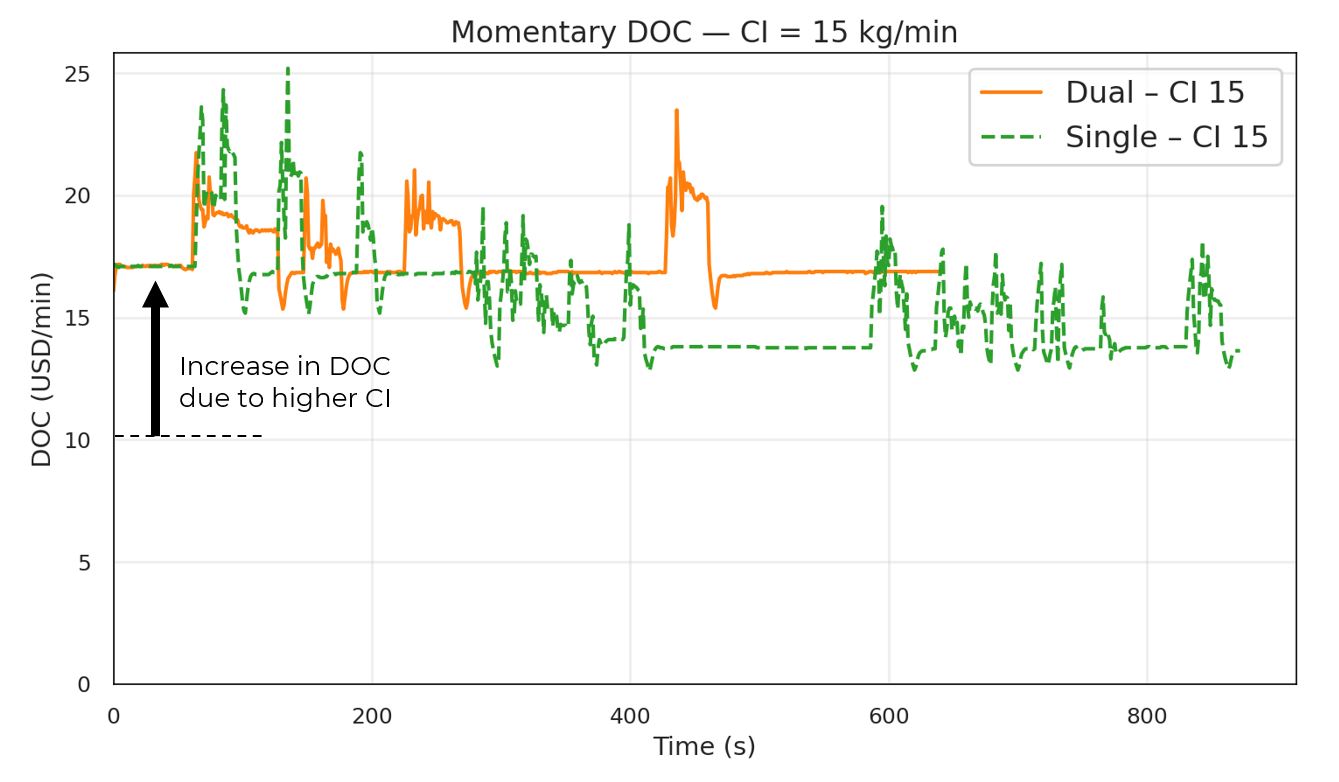
Although the underlying taxi-time and fuel-burn profiles stayed identical, the higher Cost Index pushed the entire DOC curve noticeably upward. Taxi times in the charts remain the same across different CI values, since distance and speed do not change with CI. What does change is how each taxi minute is weighted in the DOC calculation – at higher CI, every minute carries a higher cost.
As an additional step to clearly show how the two Cost Index settings alter the economics, let’s overlay both CI profiles on a single total DOC chart.
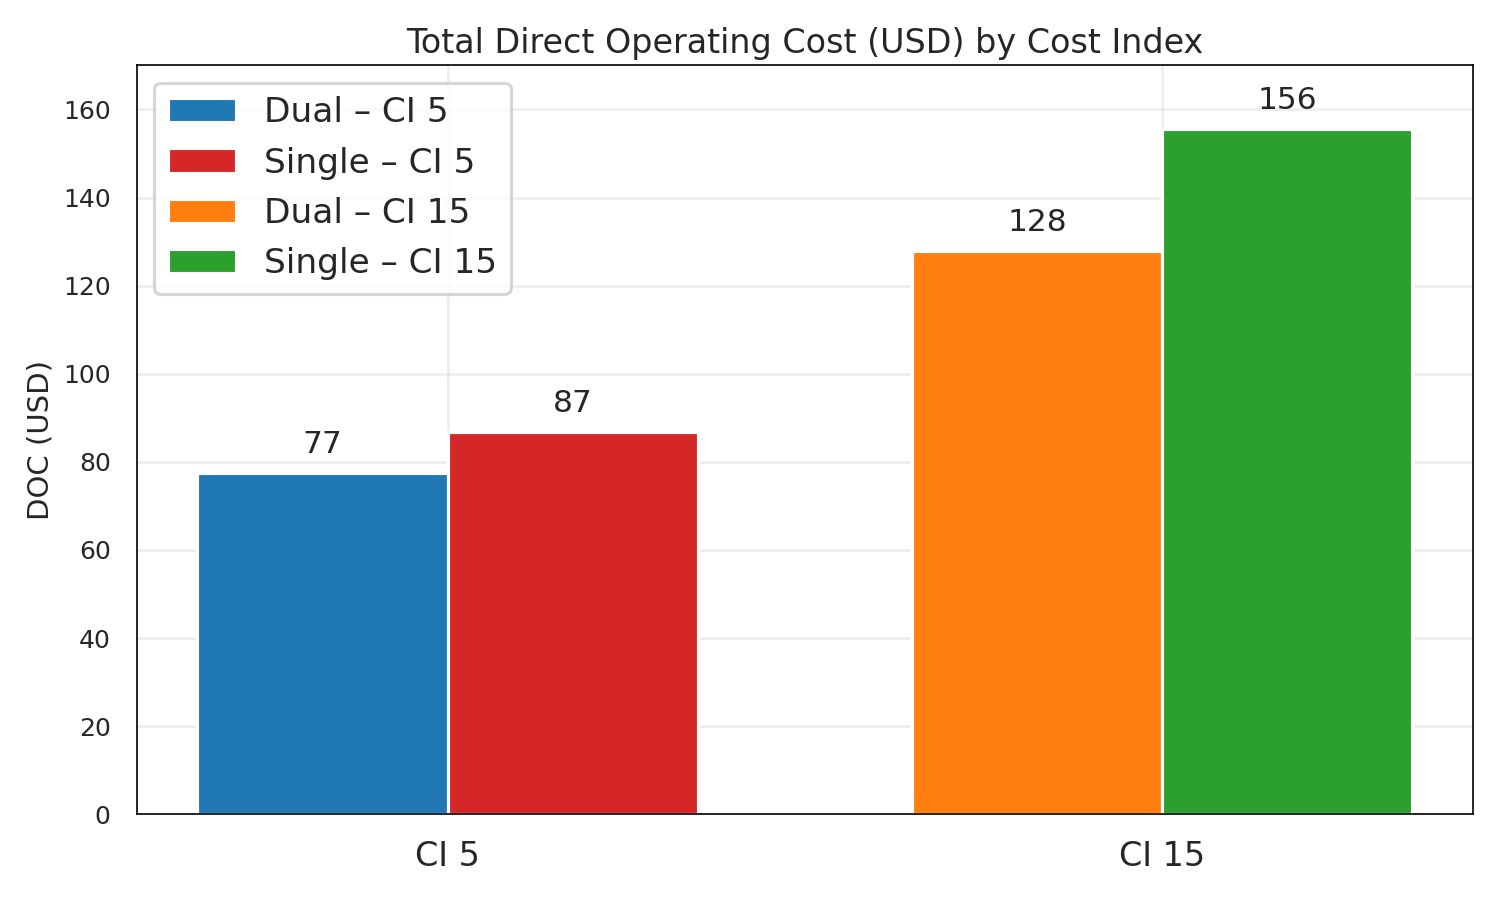
In this specific scenario, with CI = 5 kg /min, single-engine taxi can be about USD 10 higher than the dual-engine run; when CI rises to 15 kg /min, the difference grows to USD 28, as time-related costs dominate more strongly.
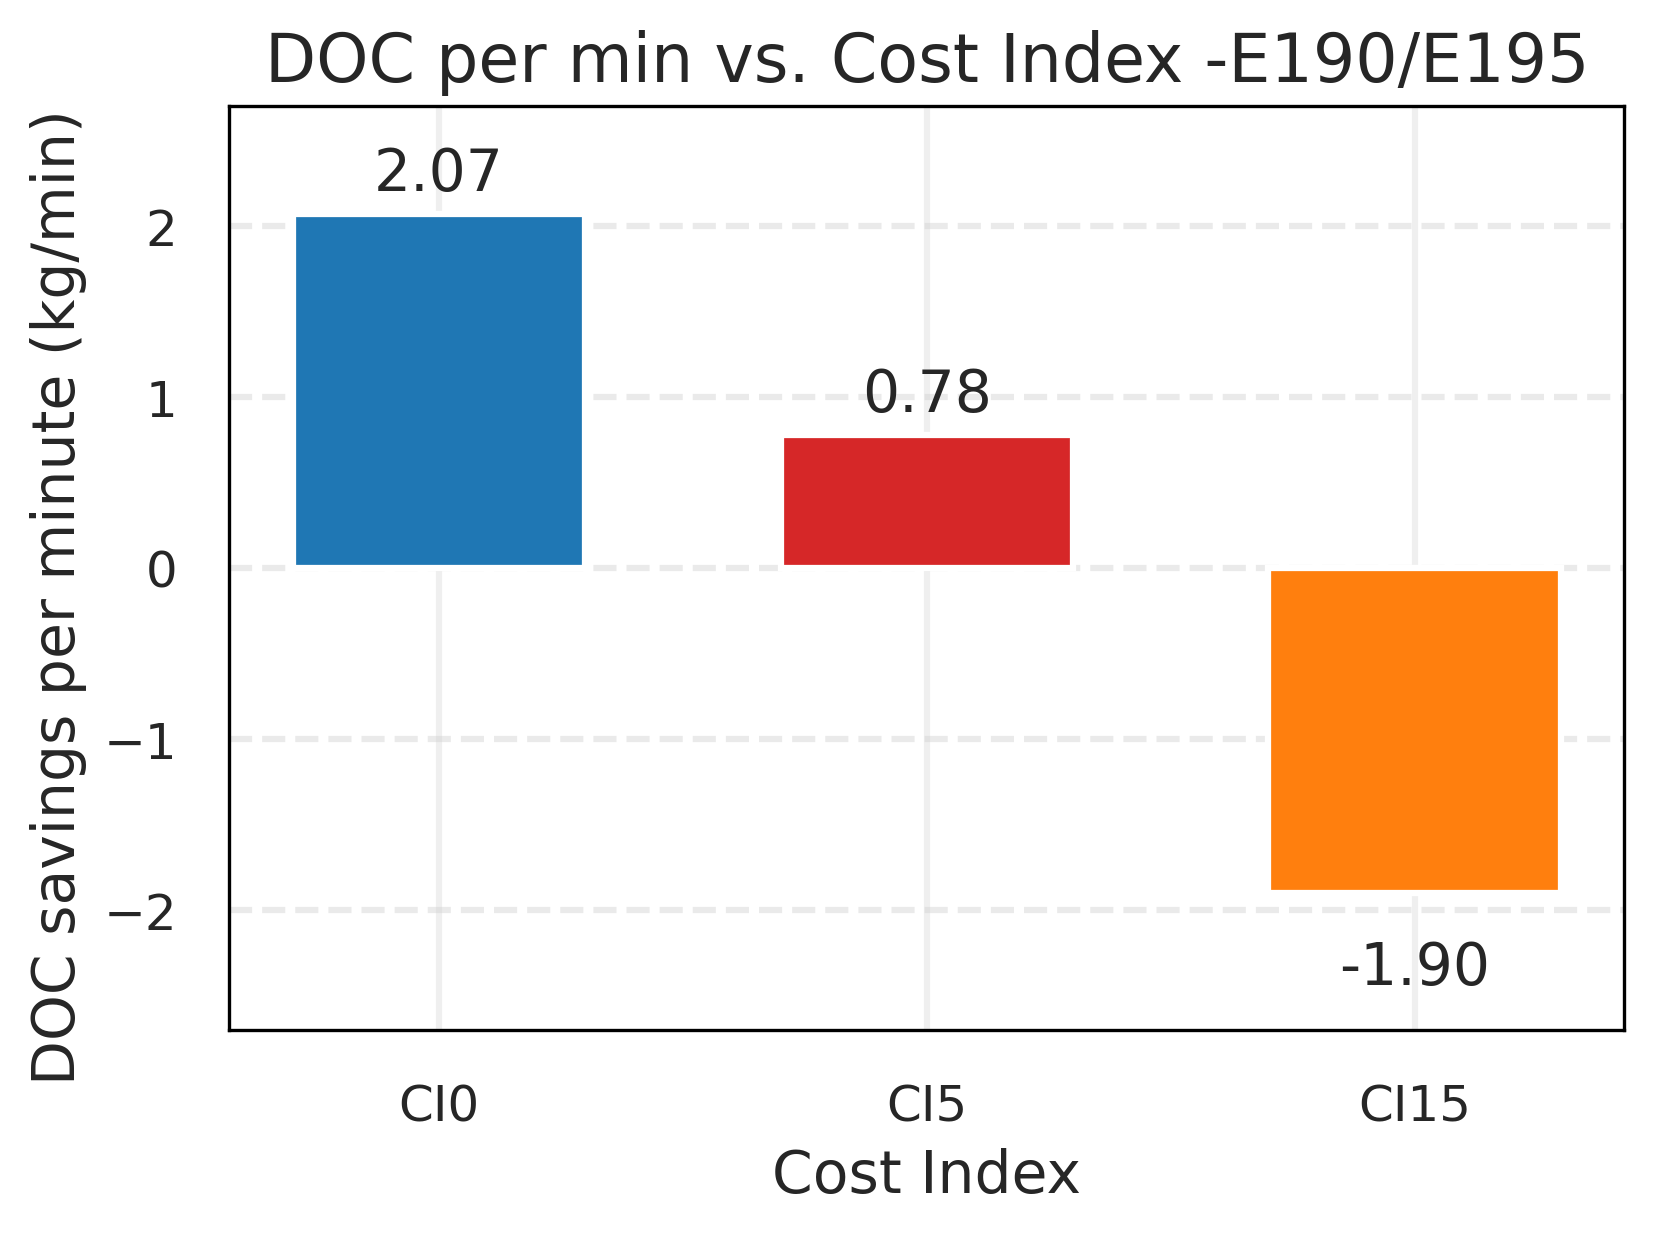
To test whether the pattern discussed above holds at scale, using the same dataset of >10 000 E190/E195 flights analyzed in our previous article, we recalculated the average DOC change per taxi minute over a wide Cost-Index range. As CI increases, the per-minute DOC advantage of SET compared to dual-engine taxi becomes smaller. Beyond a certain threshold, extra taxi time can reduce the benefit – which is why data-based use of SET, ensures capturing savings where they are strongest. This large-scale result confirms the above case study and highlights a cost effect that is often missed or maybe ignored by headline fuel-saving claims in the market.
Remember that the E190 family is powered by two under-wing GE CF34-10E turbofans (≈ 18 500 lbf each), well below the A320 family CFM56 Engine’s 27 000–32 000 lbf thrust range. Lower thrust means slower acceleration during taxi, so the time component of DOC grows faster for the Embraer. This simply means the cost balance between single- and dual-engine taxi shift earlier, reinforcing the importance of SET tailored to each aircraft type. Because engine thrust is a key driver of taxi dynamics (as detailed in the previous article), our next step is to examine a comparable dataset of A320 flights with CFM56 engines and examine how DOC savings are distributed across the Cost-Index range for that higher-thrust fleet.
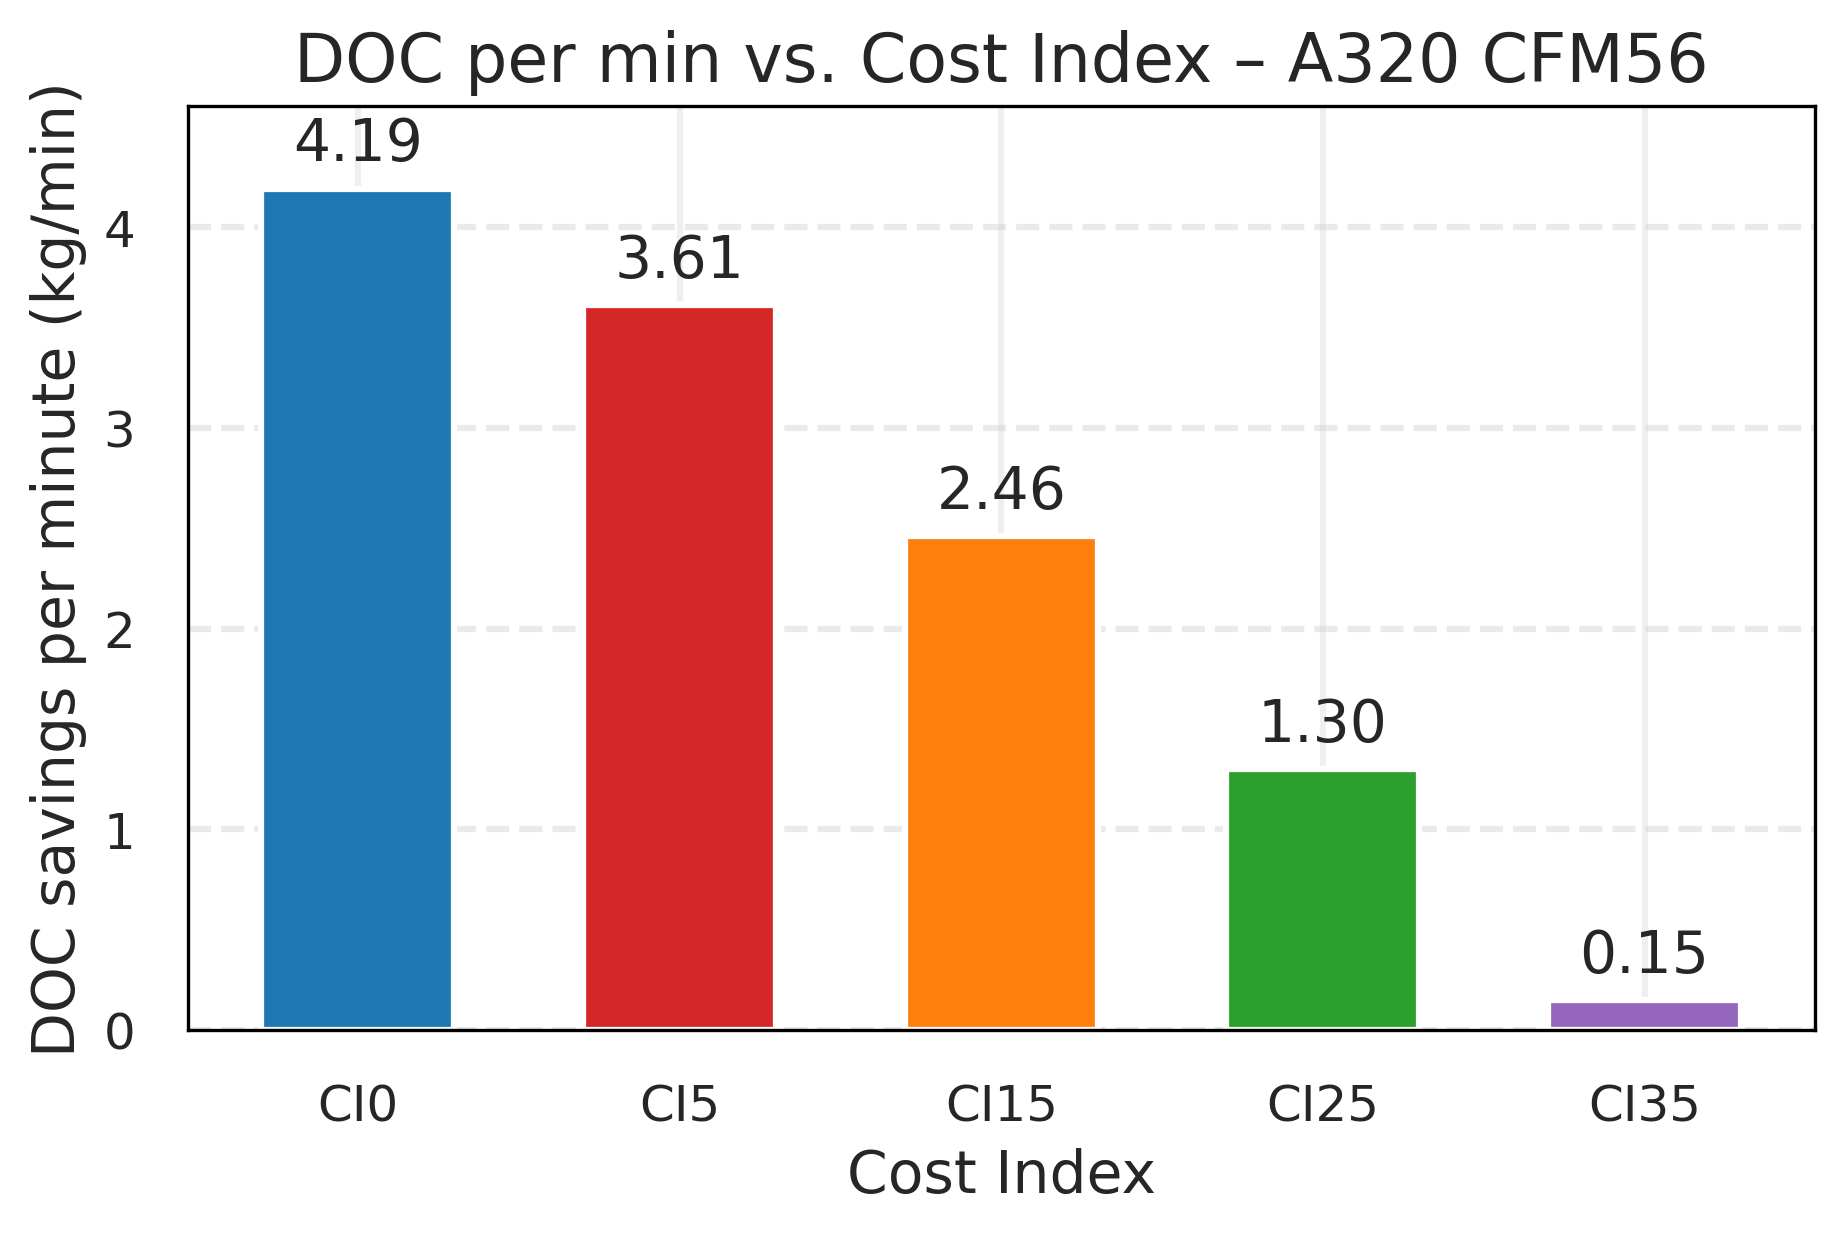
Because the A320’s higher-thrust engines let it keep up ground speed on one engine, the extra taxi time added by SET is smaller than on the lower-thrust E190s, so the resulting DOC impact is correspondingly lower.
Summary
Single Engine Taxi remains a powerful efficiency measure and should be part of every airline’s fuel saving playbook. But the smartest savings come from knowing when it works best. That is exactly where we help: with FlyGuide EFB app, pilots receive real-time guidance on the most efficient taxi choice, while FuelPro, the fuel efficiency dashboard, tracks and validates results across the fleet. Together, they turn SET from a good idea into measurable, lasting value.
Overall, SET works great in some cases, best at airports with long taxi times. We could have taken the easy way and simply described its benefits, but choosing the data-based way (in this case: highlighting when SET might not deliver) is what drives our work every day. Our analyses prove that SET gives overall benefit, but its full value is unlocked when applied selectively and guided by data.
