Single-engine taxi is one of the most popular fuel-saving initiatives worldwide. By performing single-engine taxi, airlines claim multimillion-dollar savings every year. StorkJet performed an analysis of single-engine taxi, comparing industry-standard methods with its internally developed Digital Twin taxi model. The results reveal significant discrepancies between the two approaches and a strong correlation between savings and specific aircraft-type, airport, runway, apron combinations. The conclusions highlight that current industry standards are inaccurate, largely overestimating actual and potential savings.
I Industry standards
Across industry sources, single-engine taxi fuel savings are commonly cited at 5 kg/min for A320-family aircraft by SESAR1 and 3–10 kg/min across various types in ICAO guidance2. Industry practice among airline fuel-efficiency software providers is to assume savings of approximately 5 kg/min for A320/B737 operations and 4 kg/min for E190 jets. These figures serve as high-level benchmarks for planning and performance assessments but rely on simplified idle-thrust fuel flow tables and static taxi-time assumptions. In reality, extended taxi durations resulting from reduced thrust, variable acceleration profiles, and operational variability can significantly erode these expected savings.
II Aircraft taxi mechanics
Aircraft taxi performance depends on the net longitudinal force acting at the Center of Gravity (CG). That force is the difference between:
- Engine thrust (Fthrust)
- Rolling-friction force (Ffriction), which scales with wheel load and surface condition
- The gravitational component along the slope (Fgravity)
When one engine is shut down, available thrust is roughly halved, so the net accelerating force drops and the aircraft takes longer to cover the same distance. By Newton’s second law (F = m × a) the reduced net force means proportionally lower acceleration a for the same aircraft mass m. Pilots can regain part of the lost force by advancing the live-engine thrust lever, but idle-taxi procedures normally cap N1 at its maximum recommended limit of about 40%. The amount that can be recovered, the excess thrust Fexcess, depends on engine idle charts, ambient conditions, and any upslope or downslope on the taxiway.
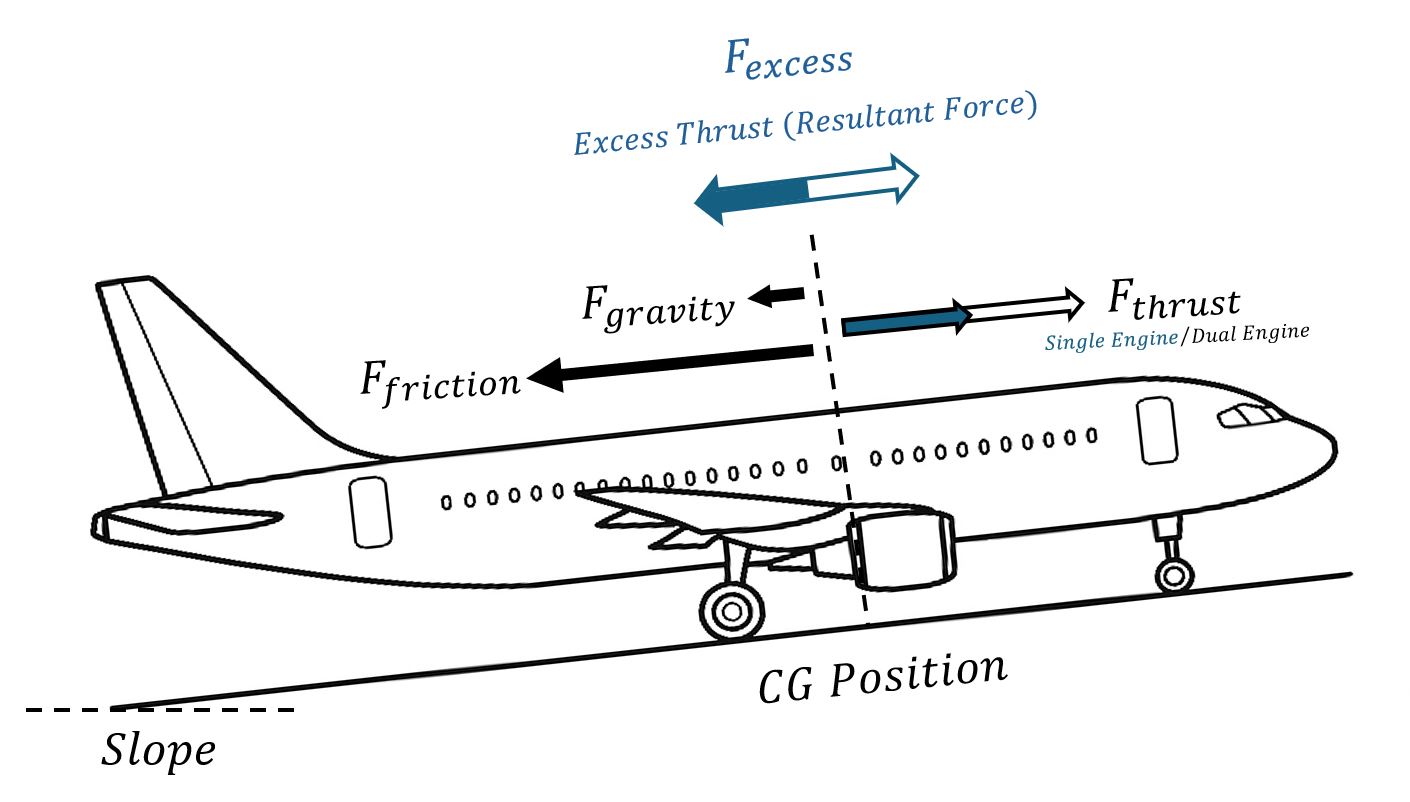
Figure 1: Distribution of longitudinal forces along a taxiway. With one engine shut down, Fthrust is roughly half of the dual‑engine case, so Fexcess can fall to nearly zero, even when the live engine is set at the maximum recommended N1 for taxi.
Figure 1 illustrates an aircraft climbing a gentle upslope. The live engine produces Fthrust, while Fgravity and Ffriction oppose forward motion. Their vector sum gives the forward excess thrust Fexcess (shown in blue). If Fexcess is small or negative the aircraft will slow unless additional thrust is applied.
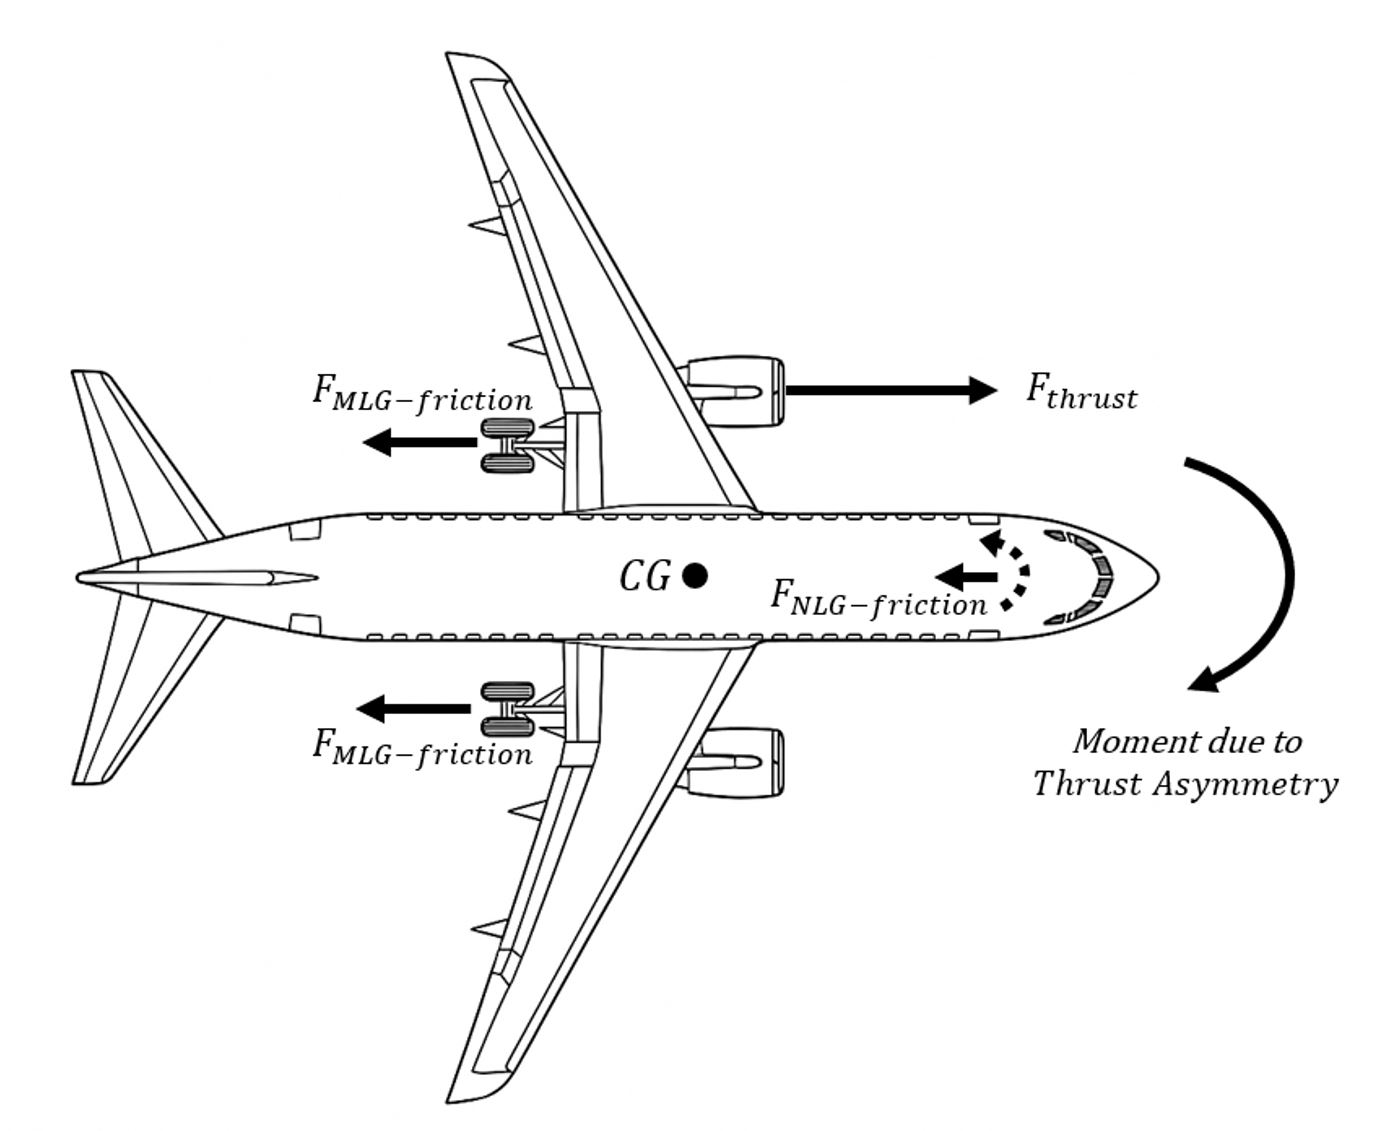
Figure 2 – Force and Moment Distribution of an aircraft during Single Engine Taxi
With one engine shut down, the live engine produces forward thrust Fthrust on one side of the CG. Main- and nose-gear rolling-friction forces (FMLG-friction, FNLG-friction) oppose motion. Because thrust is off-center, it creates a yawing moment that tends to swing the nose away from the live engine. Pilots counter this moment by steering the nosewheel toward the live engine, generating a lateral cornering force that keeps the aircraft aligned with the taxiway center-line.
III Aircraft taxi techniques
According to pilot testimonies, aircraft manufacturers make no procedural distinction for taxi techniques when single-engine taxi is used. The published techniques focus on brake usage, with the objective of applying the minimum thrust possible to avoid excessive brake wear. Such an optimisation objective can lead to a technique in which pilots advance the thrust lever only to start taxiing or to keep the aircraft moving. Given the mechanics of single-engine taxi, this approach can result in longer taxi times and may significantly reduce savings, or even create a fuel penalty, as well as negatively affect on‑time performance (OTP) if taxi delays propagate into the flight schedule.
IV Analysis by comparing similar flights
To check the underlying dynamics, we analyzed two random taxi-in flights using the same aircraft type (E190), with nearly identical landing weights and runway exit intersections, under comparable weather and traffic conditions. One taxi (Flight 1) was performed with both engines running (dual engine), while the other (Flight 2) was completed with a single-engine shutdown. To minimise environmental variability, we selected Istanbul Airport (IST), known for its relatively flat and long taxiways. The two aircraft landed on the same runway, used closely matched taxi paths, and parked at the same stand/gate. Their landing weights—43,204 kg and 43,106 kg—were nearly identical.
To ensure a fair comparison, we analyze each taxi run only between the “start point”, where both aircraft have just exited the runway, and the “split point,” where Flight 1 makes its brief full-stop (see below map). Truncating both traces at this split point eliminates the 30-second stationary period present only in the dual-engine case and allows us compare the two profiles on an apples-to-apples basis, isolating the savings or penalties attributable to single-engine taxi.
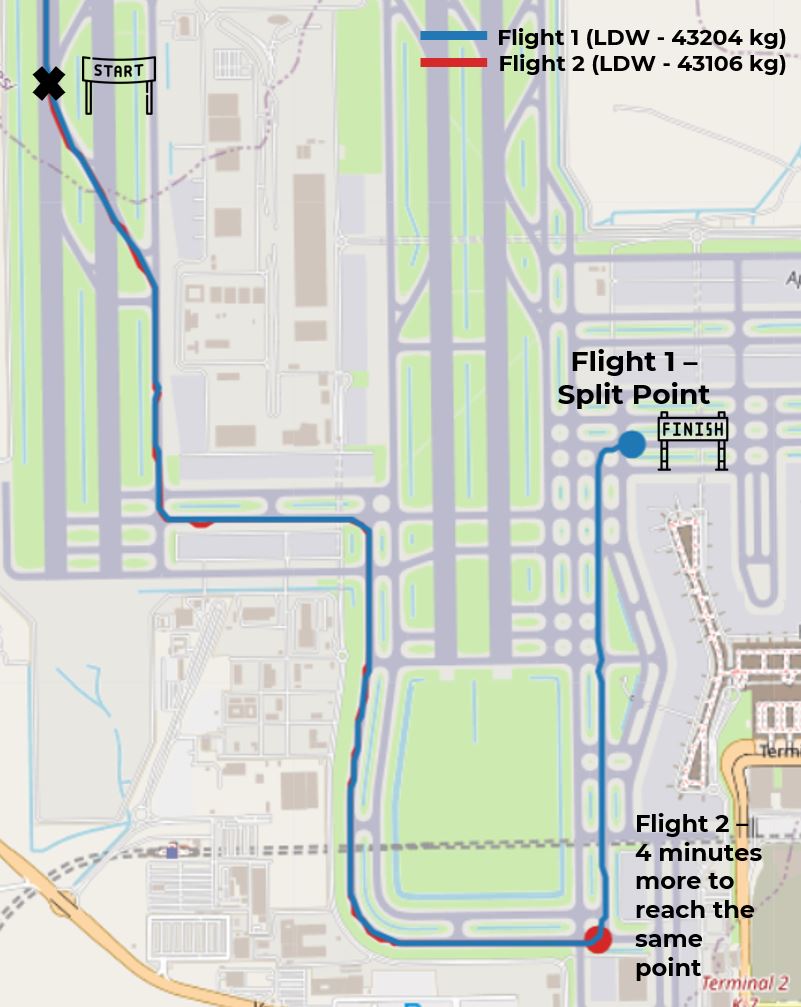
Figure 3 – Dual Engine (Flight 1) and Single-Engine (Flight 2) – Two identical taxi profiles. The red dot marks the aircraft’s (Flight 2) position at the moment Flight 1 reaches the split point.
As shown in the below engine fuel flow charts, Flight 1 operated under dual-engine conditions, while Flight 2 used only one engine. Flight 2 experienced a noticeable reduction in acceleration after the engine shutdown despite active compensation of thrust by the pilot, whereas Flight 1 maintained a generally higher taxi speed. Ultimately, the dual-engine flight arrived at the full-stop 250 seconds (about 4 minutes) earlier than its single-engine counterpart. This delay added additional single-engine fuel consumption for Flight 2, offsetting the savings gained from shutting down one engine.
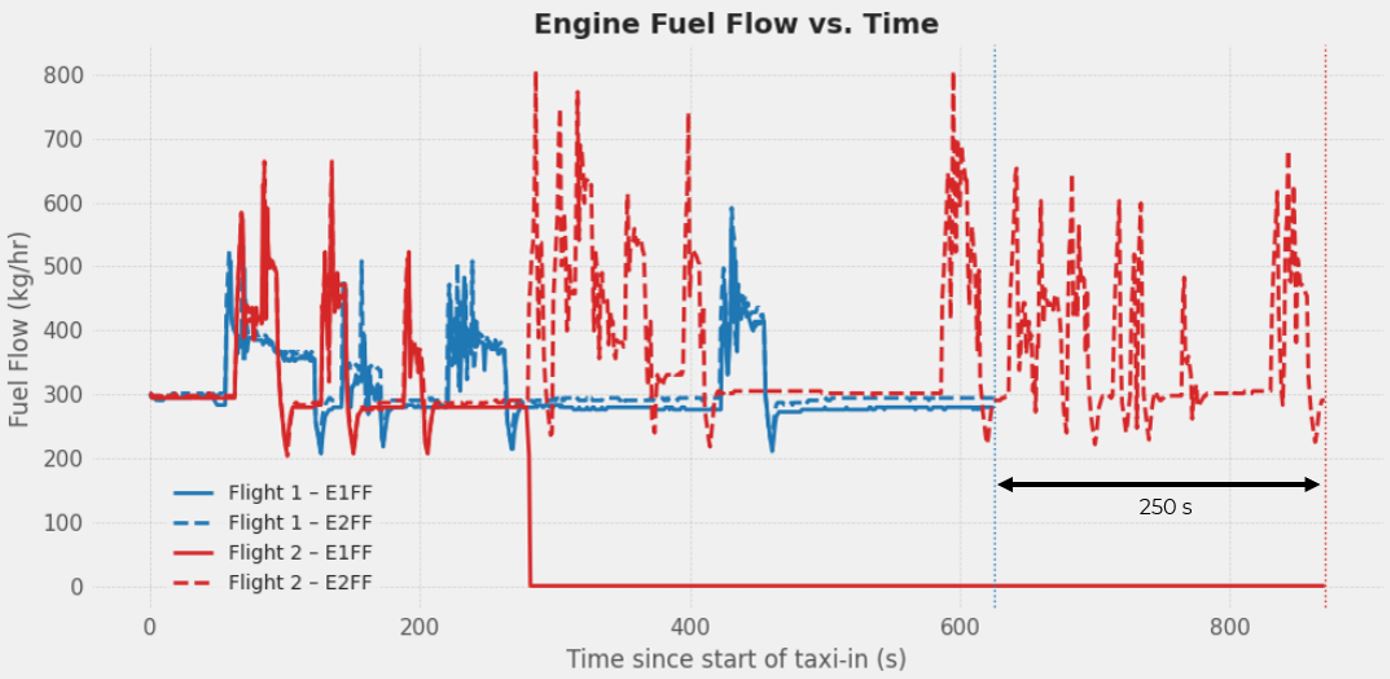
Figure 4 – Flight 1 and Flight 2 – Engine Fuel-Flow Profiles

Figure 5 – Flight 1 and Flight 2 – Ground-speed Profiles

Figure 6 – Flight 1 & Flight 2 – Fuel Burn Profiles
Figure 6 plots cumulative fuel burn from the start of taxi‑in for Flight 1 (dual‑engine, blue) and Flight 2 (single‑engine, red). Competitor methodologies typically declare savings at the moment the dual‑engine aircraft reaches the stand (marked by the blue vertical line and labelled “Claimed Savings”). At that instant, Flight 2 has burned about 22 kg less fuel than Flight 1, yielding the textbook “4 kg per minute” saving over the 5.5 min of single‑engine operation.
- Claimed Savings: 5.5 min (330 s) × 4 kg/min (for E190) ≈ 22 kg
However, Flight 2 still has to taxi for another ≈ 4 minutes to reach the same split point. During that extra time the live engine continues to burn fuel, erasing the initial savings and adding roughly 25 kg of additional consumption (shown by the black vertical right arrow). When the red trace finally reaches the stand (indicated by the red vertical line) the net outcome is –3 kg: fuel penalty rather than a saving.
For Embraer E-Jets, a single running engine drives two 40 kVA integrated drive generators (IDGs), so no extra APU power is required during single-engine taxi. In both flights, the APU fuel burn remained constant (≈ 7.1 kg versus 6.5 kg for the taxi-in), contributing no differential penalty. By contrast, aircraft types such as the B737 or A320 often keep the APU running during single-engine taxi to supply bleed air and electrical power, adding a further fuel penalty that must be considered when assessing the true savings.
This example makes one thing clear: quantifying single-engine taxi savings using a fixed per-minute rate does not reflect the real-world dynamics of acceleration, and resulting penalties due to the delay. In above example, although we manage to find a nearly identical “comparable” flight, such cases are rare because of high variability of environmental and operational factors.
That is why StorkJet developed machine learning (ML) models that serve as a Digital Twin of aircraft taxi operations. By simulating every second of a flight under identical conditions, the model isolates the true effect of an initiative and delivers reliable, scenario-specific savings grounded in operational reality rather than assumptions.
IV Analysis using machine learning models – Digital Twin concept
As explained in “Aircraft taxi mechanics” chapter, the ground-speed during taxi is governed by engine thrust, aircraft weight, taxiway slope, surface type, traffic density. Engine thrust and braking are controlled by the pilot. StorkJet’s Digital-Twin model captures all of these variables, along with fuel-flow and APU usage, from QAR data. The machine learning (ML) model is trained to replicate taxi point-performance including historical pilot thrust lever and braking behavior. Integration of data points along the taxi route is performed using classical mechanics.
This allows below complementary calculations:
- Saving potential: dual-engine flight → “What if” the same taxi were performed with single-engine?,
- Achieved saving: single-engine flight → “How much” was saved relative to a dual-engine simulation?,
assuming historical taxi technique, optimized or predefined.
Because of the model’s design, Digital‑Twin simulations can be applied to every flight, providing meaningful statistics that reveal true savings. This overcomes the main limitation of the “comparable‑flights” approach, where near‑identical matches are both rare and often biased.
To show how this works, below we introduce a third trace, Simulated Flight 1, which represents the same taxi as Flight 1 but with the earliest practical single-engine cut-off. The left engine is idled 120 s after touchdown to satisfy the manufacturer’s cooldown requirement.
The figure now shows three profiles for both ground speed and fuel flow:
- Flight 1 – the original dual-engine taxi profile
- Flight 2 – the reference single-engine taxi profile
- Simulated Flight 1– the Digital-Twin simulation of Flight 1 with maximum single-engine use

Figure 7 – Flight 1 & Flight 2 & Simulated Flight 1 – Engine Fuel Flow Profiles

Figure 8 – Flight 1 & Flight 2 & Simulated Flight 1 – Ground-speed Profiles

Figure 9 – Flight 1 & Flight 2 & Simulated Flight 1 – Fuel Burn Profiles
Figure 9 – the fuel-burn distribution plot reveals a clear difference between the simulated single-engine profile for Flight 1 and the actual single-engine taxi (Flight 2). Flight 2’s crew shut down the engine 300 s after touchdown and was mildly adding thrust to keep up the speed. From start point to split point, Flight 2 consumed 3 kg more fuel than Flight 1. The simulation of Flight 1 applies the earliest allowable cut-off—120 s after touchdown and uses thrust lever less actively, resulting in average ground speed of ~10kt while taxiing on single engine. As a result, the aircraft reaches the split point later, incurring roughly 17 kg of extra fuel burn relative to Flight 1’s dual-engine trace. In other words, extending single-engine taxi in this particular scenario increased fuel burn rather than reducing it.
V Accuracy of machine learning models
Calculating the accuracy of machine learning models is important to validate results. The histogram below plots the StorkJet’s ML Digital-Twin model’s percentage error for more than 10 000 taxi-in segments, separated into single-engine (blue) and dual-engine (orange) cases for E190 & E195. Error is defined as:


Figure 10 – Digital Twin – Error Distribution for Dual/Single Engine
Both distributions are bell-shaped and centered close to zero, indicating an unbiased estimator. More importantly, 95% of all runs fall within ±5 %, and the worst-case deviations stay below ±10 % for both operating modes. This Gaussian-like spread confirms that the Digital Twin reproduces real-world taxi fuel burn with high fidelity, whether one or both engines are running, providing a robust basis for reliable savings calculations.
VI Large scale results
Histogram of achieved single-engine-taxi savings per minute for more than 10 000 E190/E195 taxi-in segments shows a mean of ≈ 2 kg per min and a median of ≈ 1.3 kg min-1. This is roughly half of the 4 kg min-1 figure often quoted in commercial brochures and rule-of-thumb tables.
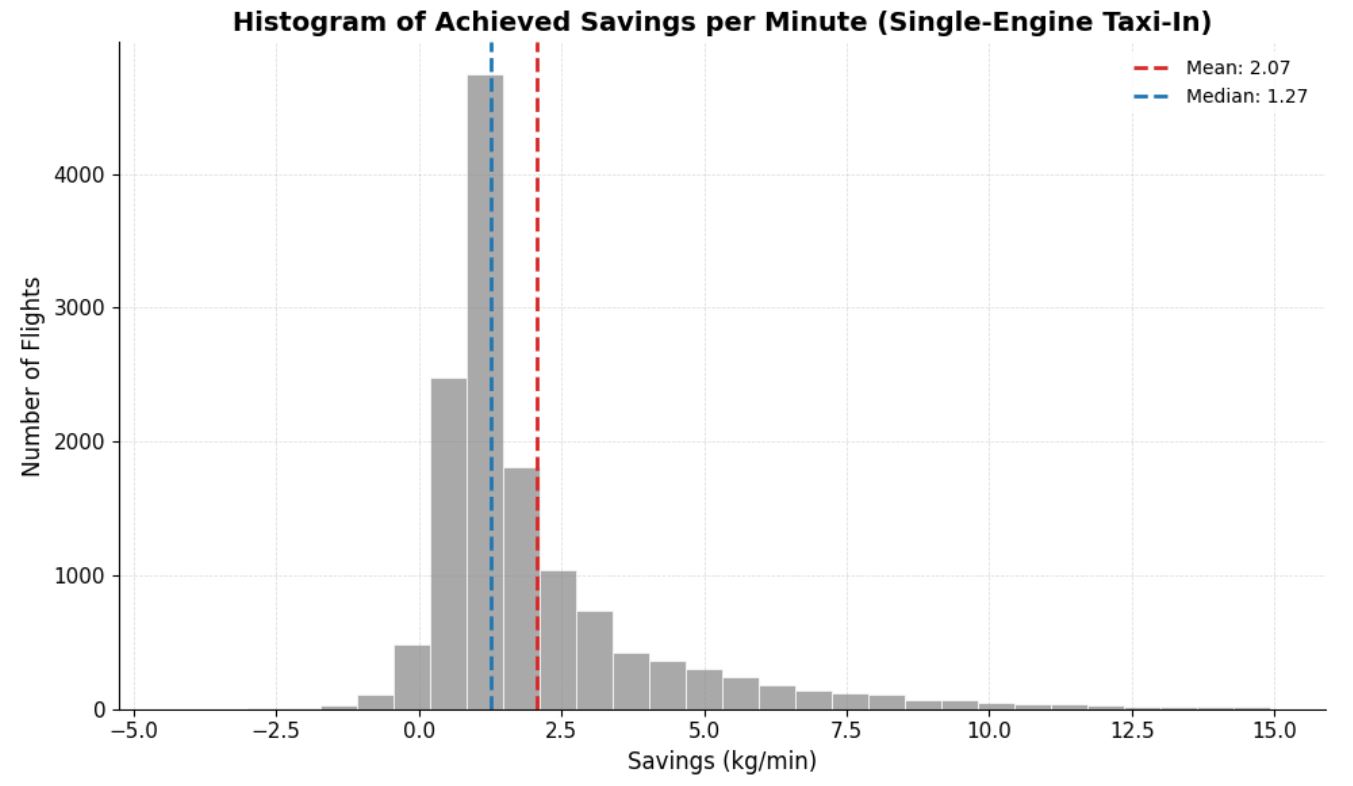
Figure 11 Digital Twin – Achieved Savings per minute for E190/195
The distribution is also highly skewed: while most flights cluster between 0 and 2.5 kg min-1, a tail extends toward both negligible and exceptionally high values. This spread reflects the many factors that a constant “per-minute” number cannot capture:
- Aircraft & engine characteristics – thrust excess at idle, the need to use APU, the aircraft weight
- Taxiway and apron characteristics – upslopes, downslopes, taxiway PCN (pavement texture & strength), number of turns.
- Traffic patterns – stop–start queues at busy hubs increase savings, whereas uninterrupted taxi decreases them.
- Taxi technique – throttle “bumps,” coasting habits, and brake-management strategies vary widely among crews.
Because these influences differ by airport, environmental conditions, time of day, and crew, a single average value risks large error when applied to any specific flight. By contrast, the Digital Twin ML model quantifies savings flight-by-flight, reproducing accurate acceleration profiles and fuel flow under the exact conditions experienced, and thereby delivers both the fleet-level mean and the variability envelope needed for decision-making.
VII Conclusion
1. Rule-of-thumb figures substantially overstate single-engine-taxi (SET) savings.
Across more than 10 000 E190/E195 taxi-in segments, the Digital-Twin analysis found an average saving of ≈ 1.8 kg min-¹ (median ≈ 1.3 kg min-¹) versus the 4–5 kg min-¹ values still quoted in many planning guides—an overestimate of roughly 2 –3 x.
2. Savings are highly situation-dependent and can even become negative.
Factors such as aircraft/engine variant, weight, taxiway slope and surface, traffic density, APU usage, and—critically—pilot thrust and brake technique drive a wide dispersion in outcome, with potential knock‑on effects on OTP when extended taxi times create departure/arrival delays. In several matched-flight case studies the extra time spent taxiing on one engine actually consumed more fuel than it saved.
3. Digital-Twin machine learning (ML) models reproduce real taxi fuel burn with high fidelity.
For both dual- and single-engine runs, 95 % of predictions lie within ±5 % of actual burn, with no systematic bias, giving management the statistical confidence needed to make flight-by-flight decisions.
4. Traditional “comparable-flight” or fixed-rate methods cannot capture this variability.
Near-identical flights are scarce and static per-minute factors ignore acceleration losses, thrust-lever bumps and APU penalties, leading to order-of-magnitude errors for individual flights and distorted fleet business cases.
1 https://www.sesarju.eu/sites/default/files/documents/webinars/Guiseppe.pdf
2 https://www.icao.int/MID/Documents/2018/Joint%20ACAO-ICAO%20ASBU%20Symposium%20for%20EUR-NAT%20and%20MID%20Regions/4.4-2%20Perfect%20Flight%20-%20IATA.pdf
