StorkJet has introduced a new technology for the AdvancedAPM system which transforms observed flight data to specified conditions with unappareled precision. This enables tracking of aircraft performance on a daily basis and closes co-relation with undertaken maintenance actions. The possibilities of this new feature (based on different engine examples) are presented in this paper.
Up until now, StorkJet has shown key aircraft performance diagnostic parameters on the AdvancedAPM platform. While this is a helpful tool that shows the status of performance-related components over time, this indicator struggles with volatile changes in flight conditions like altitude, weight, or temperature. In some cases, meaningful results can be observed only after a month of regular flights.
To significantly improve this method, StorkJet introduced Normalized Diagnostic Parameters to AdvancedAPM. This system shows how the key parameters affecting aircraft performance would change if all flights were performed under the same conditions. This method removes the effects of seasonality, different flight conditions, and data anomalies. It allows analysts to extract pure changes in parameter behavior, the impact of deterioration, and unbiased trends. The Normalized Diagnostics Parameters, therefore, allow to narrow down the list of suspects during analysis.
CASE I
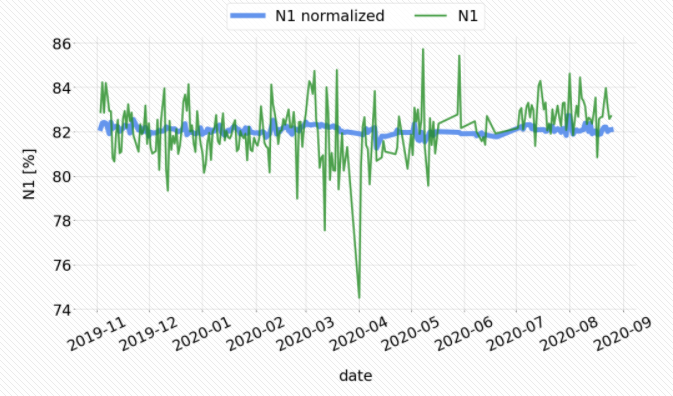
The thin line on the graph shows a conventional N1 run. A very low N1 value can be seen at the turn of March and April, and according to StorkJet’s analysis, this is the result of a very low cruising altitude of one of the flights.
The thick line shows a normalized N1 without a visible jump. This is because the normalization shows what the N1 values would be if each flight was performed under the same conditions, and, therefore, the same altitude.
CASE II
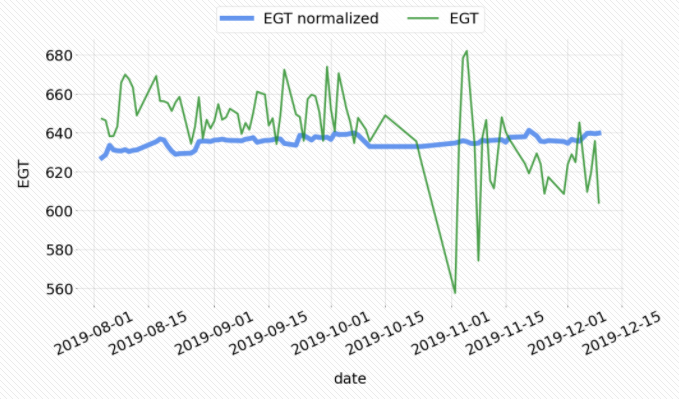
The charts shown above indicate EGT. The large fluctuations in parameters shown in November were due to extreme height and weight values. On a normalized chart, one can observe the undisturbed changes in parameters easily. When considering the EGT range, it’s important to note that it’s much smaller in the Normalized Engine Parameter chart because of the lack of environmental influences (primarily temperature dependence) that were removed by normalization.
CASE III
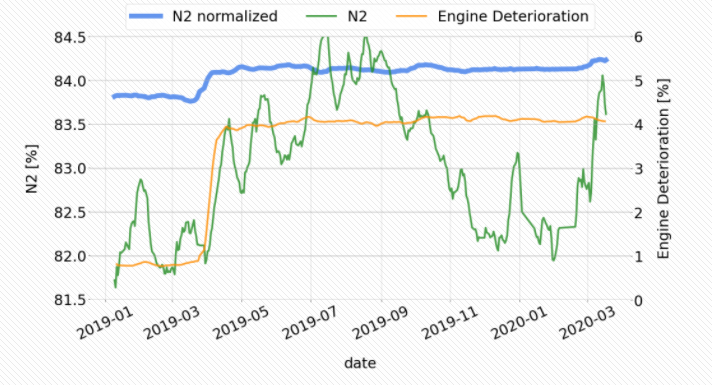
When viewing the conventional N2 chart, it is important to note the amount of noise and trends related to seasonal changes (Summer to Winter). By narrowing down the parameter changes, normalization also highlights the rapid N2 growth in late March. Results show that rapid growth is strongly associated with an increase in deterioration. While this change is difficult to see on the ordinary chart, the new system can effectively extract it thanks to the fact that it calculates what the parameter would look like if the flight conditions were exactly the same every time.
Engine parameters are normalized by combining two machine-learning models that learn from one another. These models can precisely show the changes in the parameters regardless of the conditions of the actual flights.
CASE IV
Thanks to the Normalized Diagnostic Parameters, more advanced and predictive diagnostics are available. Now, it is possible to catch changes in engine behavior and pinpoint the root cause of deterioration to avoid increased fuel burn.
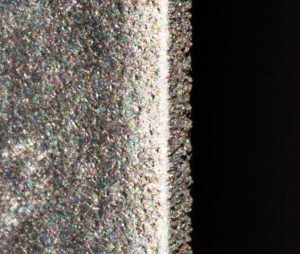
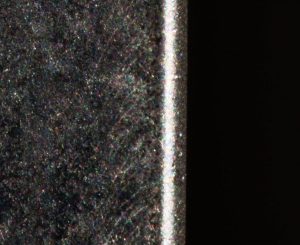
In the example of fan blade erosion, it is easy to indicate how maintenance action changes the parameters.
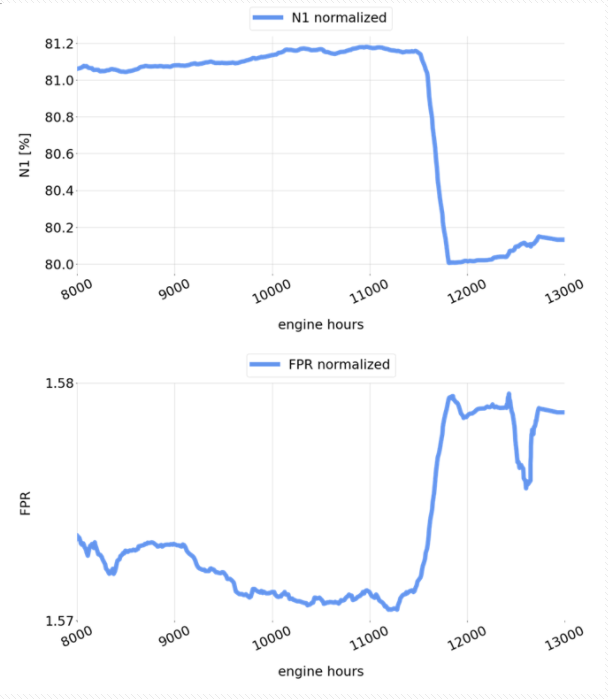
The chart above shows the Normalized N1 speed, and the bottom chart shows the normalized Fan Pressure Ratio (FPR).
Up until 11 500 engine hours, N1 was steadily increasing and FPR was steadily decreasing.
Such behavior is most likely caused by the deterioration of the fan blades. The pressure generated by the fan decreases, and in order to maintain the same thrust, the fan has to rotate at a higher speed.
At 11 500 engine hours, the replacement of the fan blades took place and parameters returned to normal.
This maintenance action resulted in 0.2% lower fuel burn.
To see the difference between the leading edge of the fan blades before and after replacement, StorkJet took microscopic photos, which can be seen below.