In the summer issue of AircraftIT magazine, Juha Kulmala, Technical Pilot and Juha Aramo, Senior Director of Flight Operations at Volotea share the benefits of using an Innovative Artificial Intelligence (AI) powered Fuel Efficiency Solution.
Article is published in AircraftIT Magazine
We want to introduce you to a case study about an artificial intelligence (AI) powered fuel efficiency and aircraft performance monitoring solution from StorkJet applied in Volotea. The Company introduced three products starting with the AdvancedAPM (Aircraft Performance Monitoring), FuelPro, and a fuel dashboard that Volotea applies to monitor the fuel initiatives running in the airline as well as report them to the management. Finally, Volotea uses FlyGuide, to assist pilots in decision-making and flight management process.
IMPLEMENTATION
The implementation project is illustrated in figure 1. It took about three and a half months to receive fully operational solutions from StorkJet, after signing the contract.
INTRODUCING STORKJET’S FUEL EFFICIENCY SOFTWARE PORTFOLIO
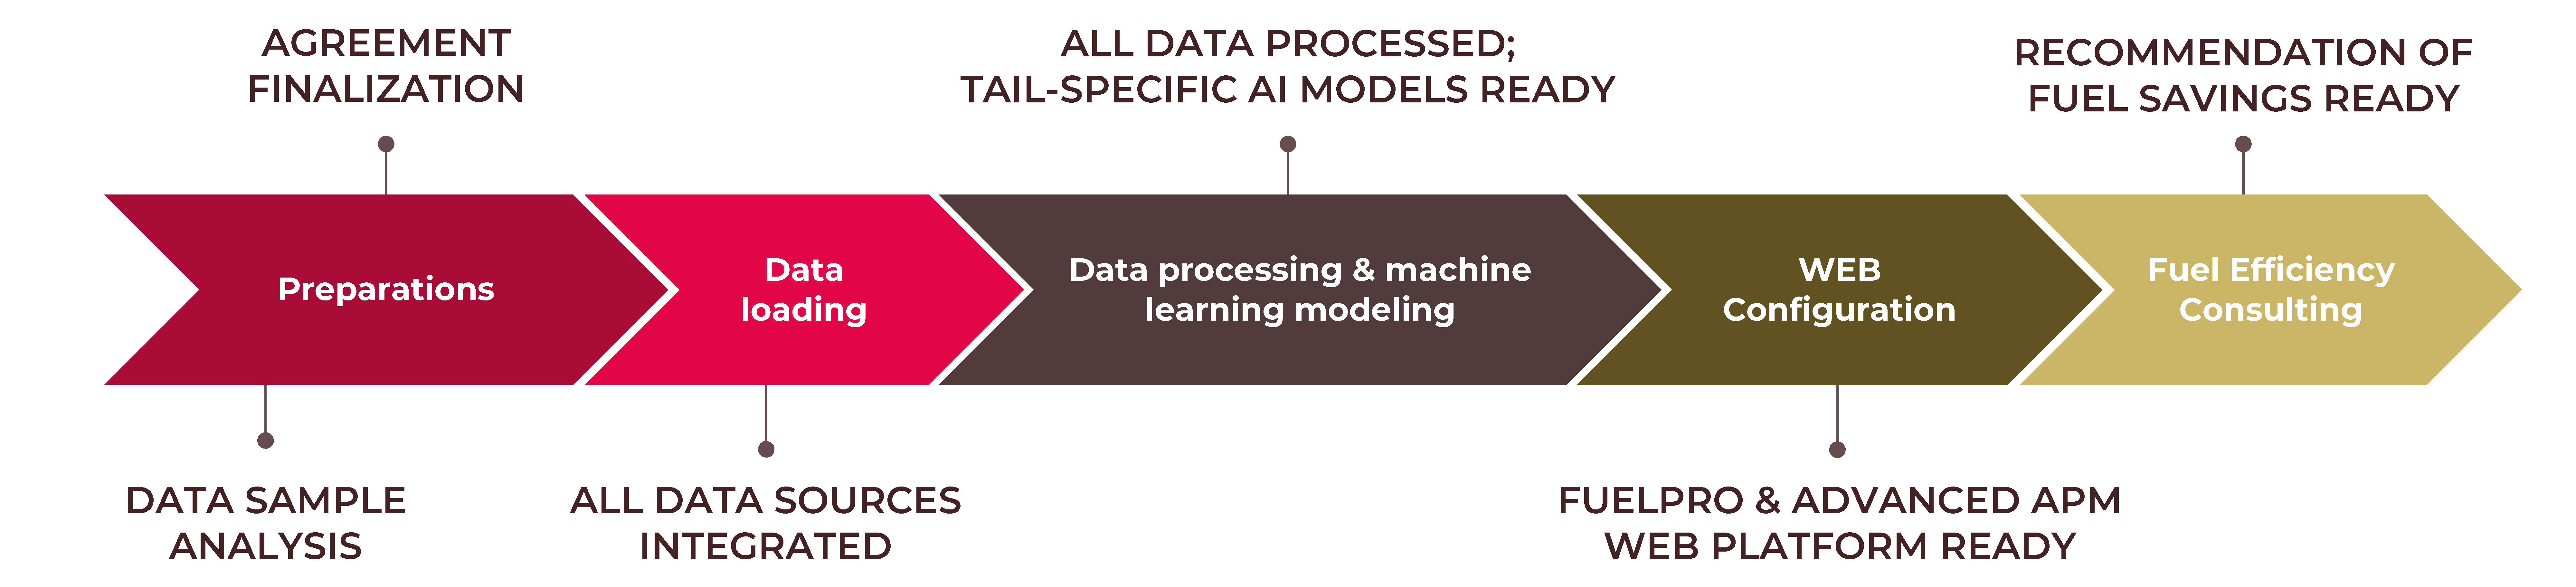
Implementation with Fuel Efficiency Consulting finished within 3,5 month
Figure 1
The implementation work included Volotea delivering the data that StorkJet needed in order to get it into the right format to be processed. StorkJet then loaded the data into the systems designed for Volotea to integrate all the data sources they are using. Finally, when the data has been processed and the tail specific aircraft performance models were ready, StorkJet applied its AI and then started the configuration of the web application that is used for the system. Volotea implemented AdvancedAPM and FuelPro almost at the same time.
After all these analyses, airline and software vendor met to discuss fuel consulting. As a result, StorkJet provided Volotea with its current fuel efficiency status as well as delivering several recommendations about further fuel saving opportunities.
BENEFITS FROM USING NEW PERFORMANCE AND IDLE FACTORS
The performance factor is a measure of the difference between the fuel consumption of a given tail and the associated performance database. Occurrences like aircraft aging, engine replacement, FOD (Foreign Object Damage) or other technical events result in a change in an aircraft’s performance, which consequently affects its fuel consumption. Precise performance factors are crucial for accurate fuel planning and building crews’ confidence in that process. On one hand, they minimize overburns and on the other hand they allow a reduction in extra fuel uplift. By using StorkJet’s APM (Aircraft Performance Monitoring), Volotea gets the tail specific aircraft performance factor without any delay. The day after the FDM (Flight Data Monitoring) QAR (Quick Access Recorder) data is sent, a new performance factor is available on the platform. Such a solution enables precise tracking of aircraft performance in comparison with occurrences or maintenance actions. This includes automatic alerting if relevant thresholds are exceeded.
The IDLE Factor is dedicated to the descent segment of flight and is taken into account for the Airbus fleet. Its aim is to adjust the optimum ToD (Top of Descent) point calculated by the FMS, so that the actual descent can be performed at IDLE thrust from ToD to final approach — such a practice ensures the lowest fuel consumption possible. Determining the IDLE Factor for the FMS is not a straightforward process, therefore IDLE factor optimization was crucial in terms of maximizing fuel efficiency in the descent phase. StorkJet was able to provide realistic figures to Volotea to be used in the planning of the descent flight path. Combining it with DPO (Descent Profile Optimization) upgrade, which is a separate Airbus solution, the descent flight path can be optimized to the most efficient level achievable. As with the Performance Factor, the IDLE Factor is regularly updated in the airline’s systems. Although Volotea’s fleet includes aircraft equipped with and not equipped with DPO enhancement, it was confirmed by real-time tests, that IDLE Factor provided by StorkJet works in both cases. Thus, IDLE Factor optimization is another solution from StorkJet, transforming the way Volotea can manage their Airbus fleet, regardless of DPO availability.
Performance factors can be integrated with the Flight Planning System via API. StorkJet will update both IDLE and the Performance Factors automatically from their system into the Flight Planning System (Volotea is using FLIGHTKEYS), to be used in flight planning calculations and provide data for the pilots.
THE DIFFERENCE BETWEEN TRADITIONAL AND NEW PROCESSES
What makes StorkJet’s APM stand out from traditional processes is the solution quality and result accuracy. First and foremost, the StorkJet solution uses QAR (Quick Access Recorder), instead of ACARS/ACMS messages. That generates much more data for analysis and does not create extra costs. With QAR data, it’s possible to measure performance from the whole flight (figure 2).
WHERE IS THE DIFFERENCE?
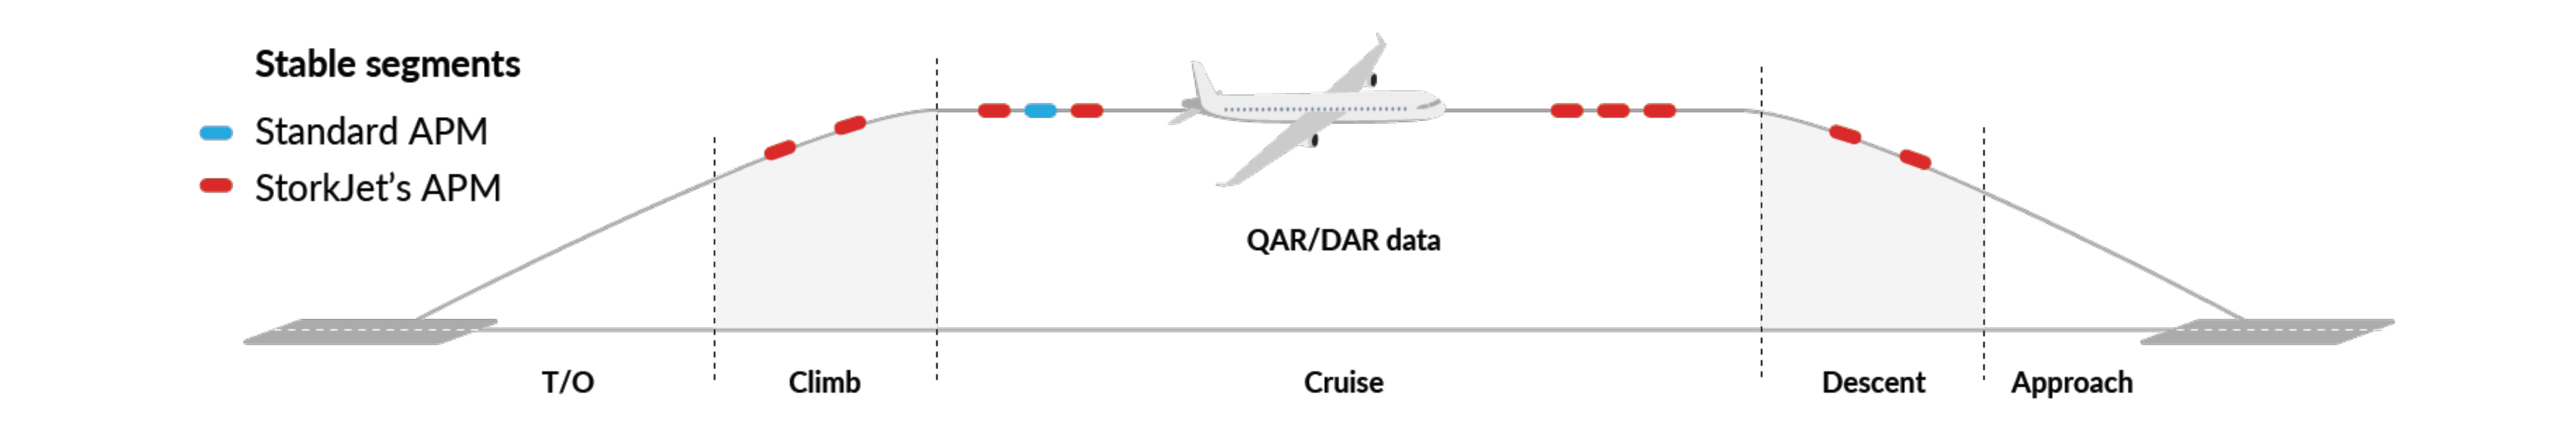
Figure 2
Limitation of the traditional process
- Performance measured only during cruise phase
- Usually 1 stable segment per flight is used for analysis
StorkJet’s approach
- For all flight phases
- Up to 50 stable segments per flight
This is one example of the value that Volotea has gained from the new system. What can be seen in figure 3 is the deterioration in engine performance. The engine got changed on the 1st of May. The chart presents results before and after the changes.
THE BENEFIT – PERFORMANCE FACTOR FOR EACH DAY
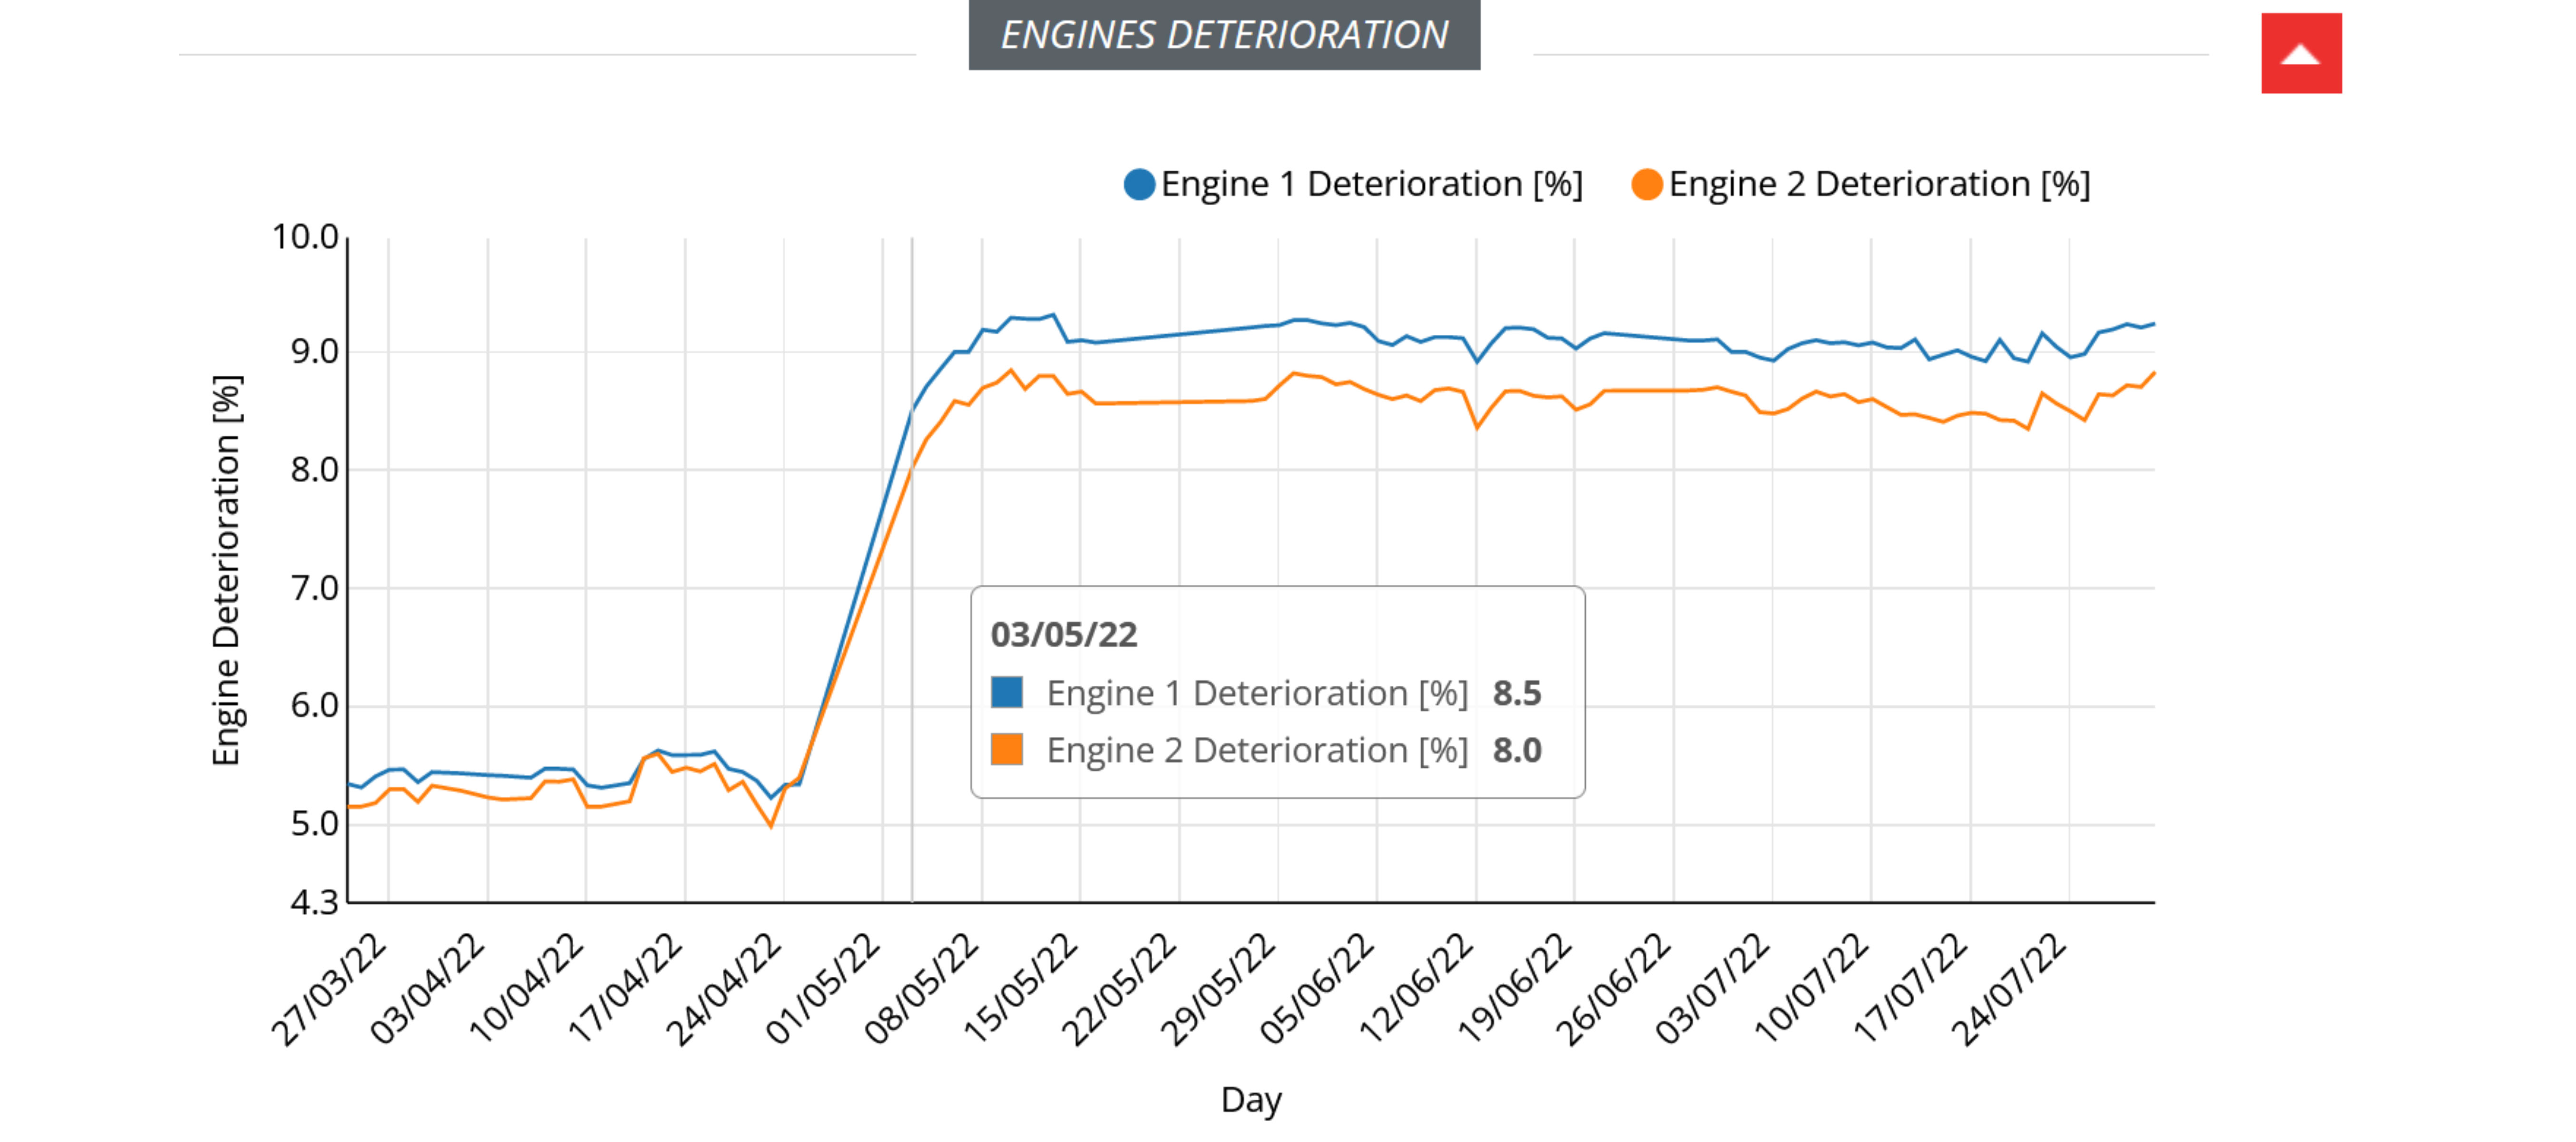
Figure 3
With such approach Volotea can react immediately to performance changes.
Performance Factors are updated immediately after the engine change or any other maintenance action.
Just after that first flight, the performance factor was updated to take into account the new engines. After three days the performance factor was established on a new steady level. It makes a significant difference to the traditional process where users have to average one or three months of data to get an update of what is the performance of the new engines. In the above case, with the traditional process, 3,5% less trip fuel than required would be planned for the next month, potentially leading to overburns. With StorkJet’s APM, the results are perfect after three days.
The last part for the APM is the IDLE Factor (figure 4).
IDLE FACTOR TO OPTIMIZE DESCENT
- What is the impact of the non-optimal Idle Factor?
-
- FMS managed descent path will not match the idle descent performance of the aircraft
- Thrust would have to be added
- 7 kg of penalty per 1% of error in Idle Factor
- How it changes?
-
- Tail-by-tail: ≈1%
- Type-by-type: 1-3%
- Month-by-month: up to 0.5%
- How is it calculated?
-
- Comparison of FMS and actual descent profile
- Based on QAR data
- Corrected for thrust, speed, acceleration, precise weather, and engine characteristics
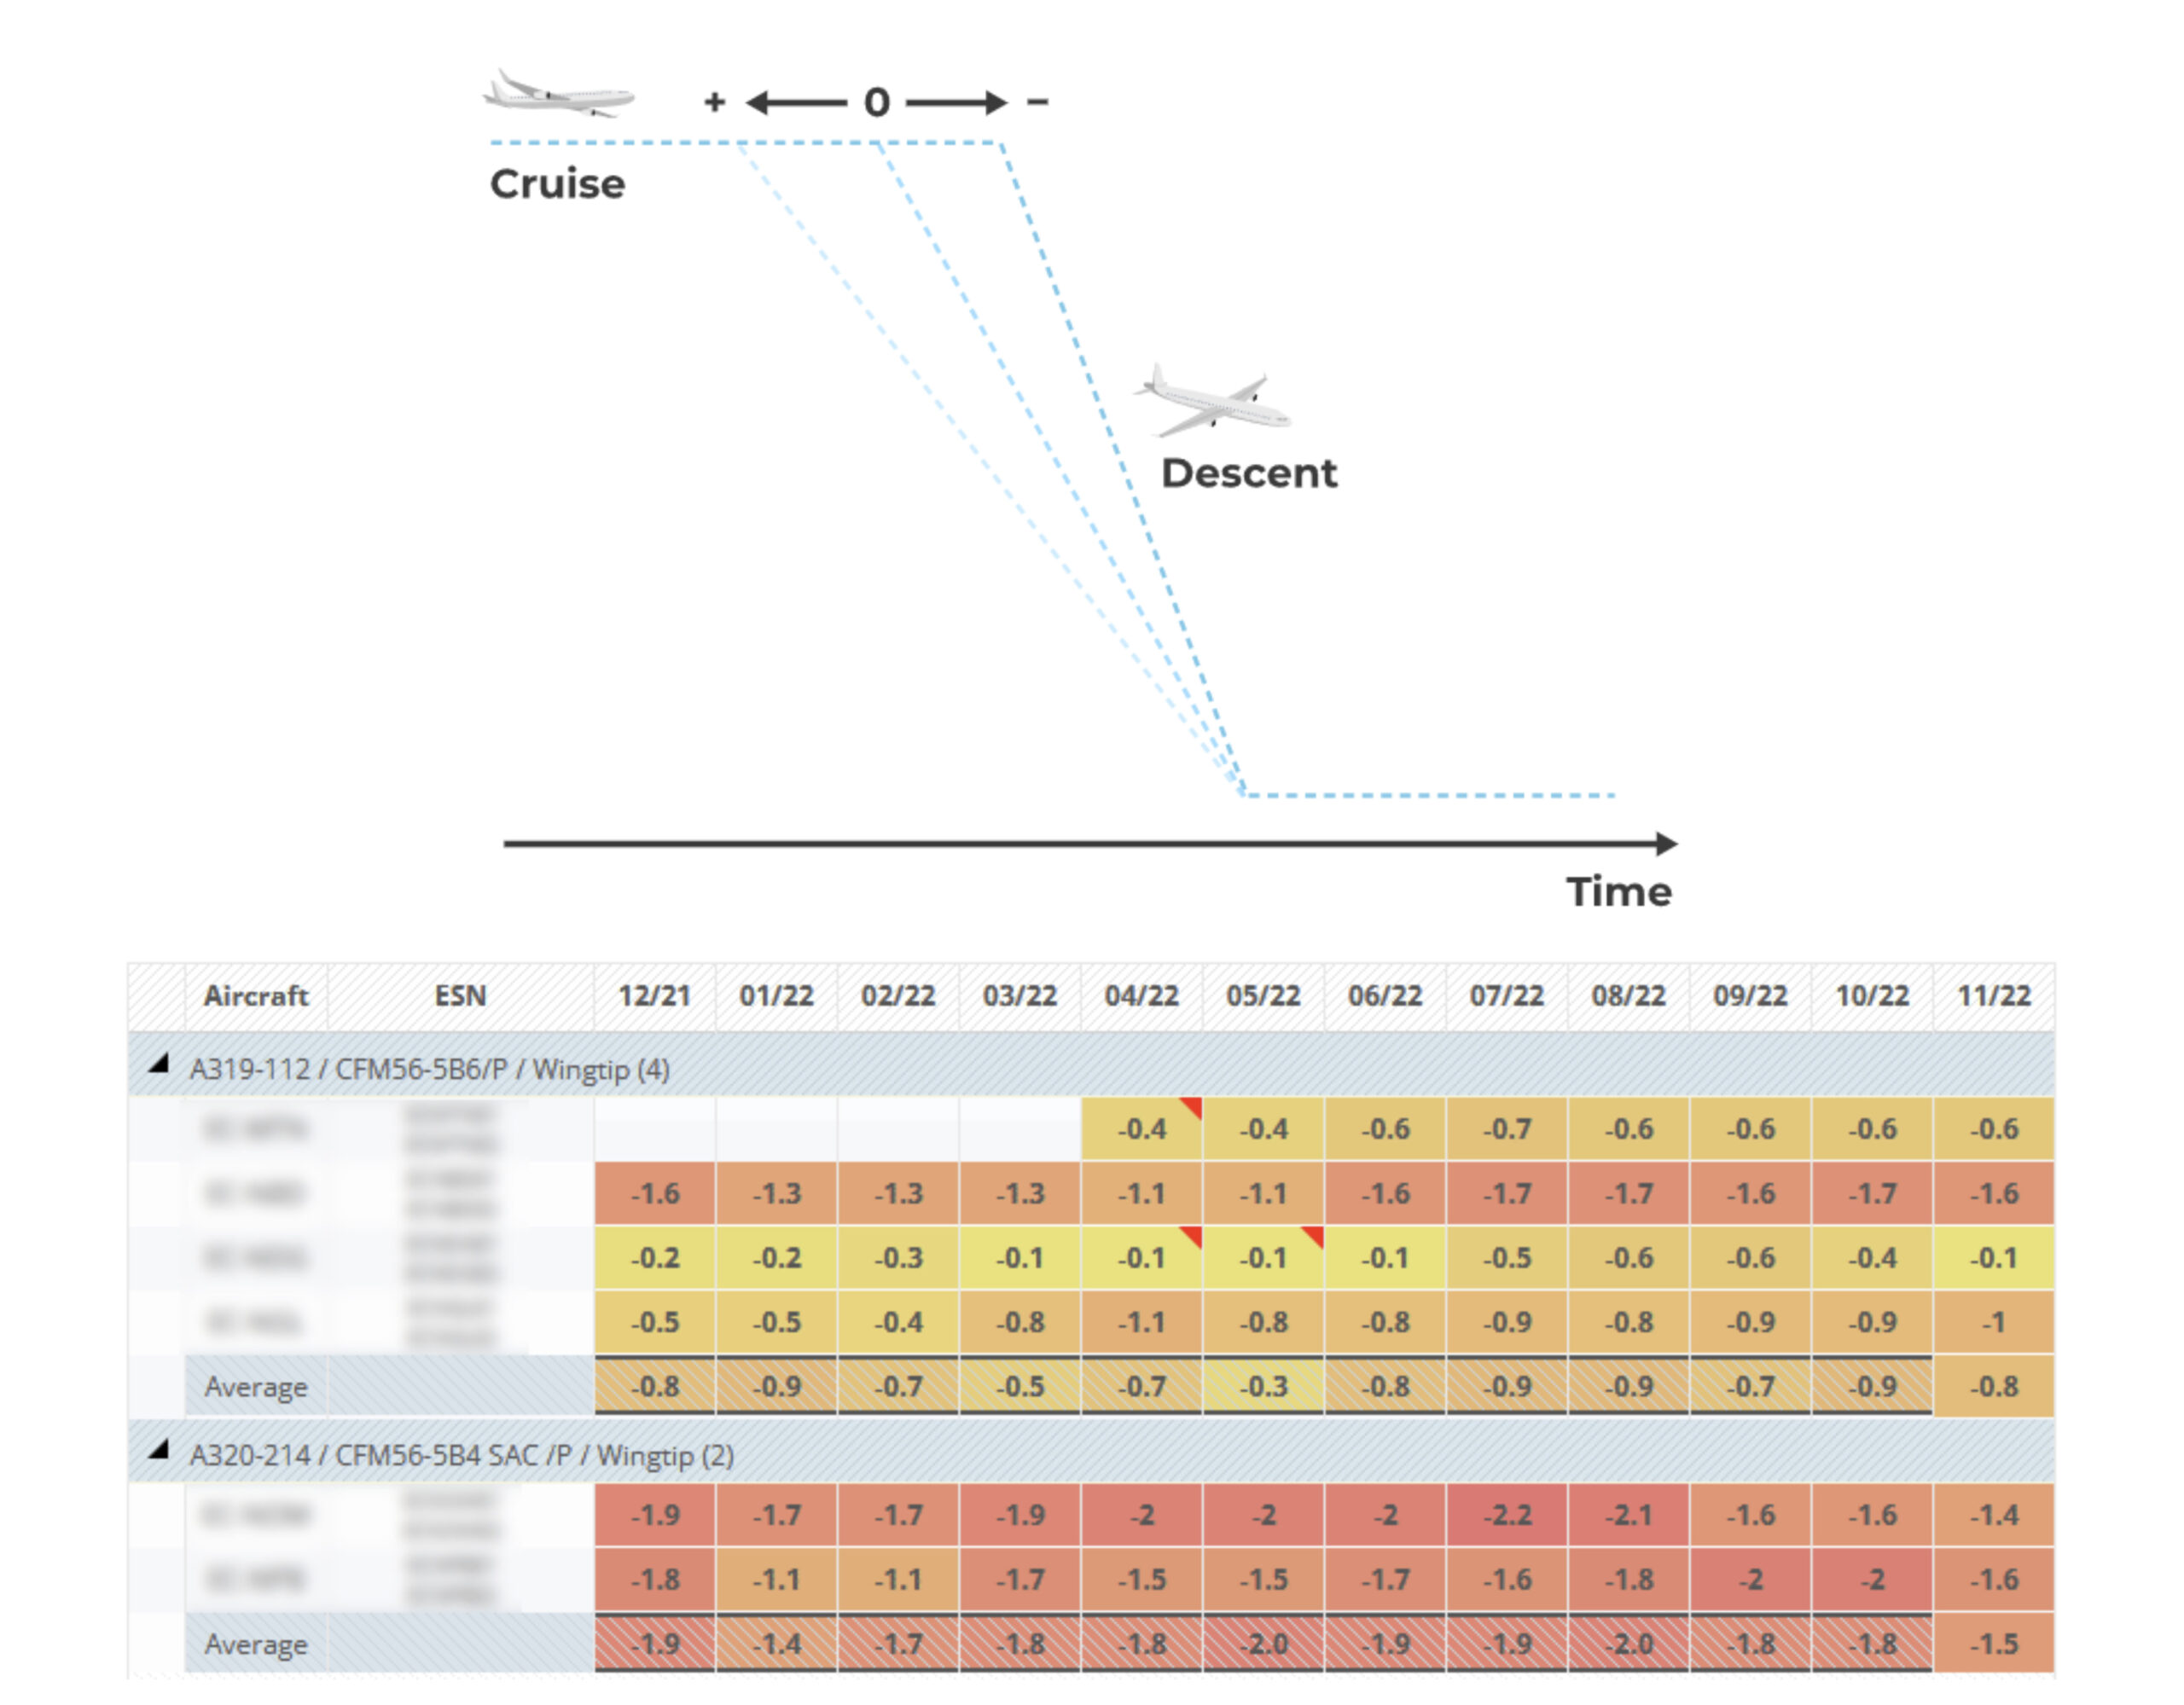
Figure 4
How does IDLE factor affect the descent flight path? Actual aircraft descent performance depends on airframe deterioration and the engine’s idle thrust. Both change over time and are sensitive to various modifications. IDLE factor incorporates these changes into a single value used by FMS to compute the descent path accurately for a given tail.
Incorrect IDLE factor results in the FMS flight path being too steep or too shallow. This is undesirable because it requires a pilot to fly with non-economic speed, use thrust or use speed brakes. In every case, this results in extra fuel burn, CO2 emission and cost, but may also negatively affect noise abatement.
What is the fuel penalty related to the non-optimum IDLE factor? More or less 7kg of fuel penalty per 1% of error in the IDLE Factor. For Volotea, the average differences in the IDLE Factor were 1%, which is already 7kg per descent. This however depended heavily on the aircraft type. It is quite often the case that the different aircraft types have very different optimum IDLE Factor — even a 3% difference between the types was observed. Also, it has been found that the IDLE Factor for each aircraft tail changes even by up to 0.5% from month to month. The key takeaways are that one cannot assume ‘one optimum IDLE Factor’ for the whole fleet, and that the continuous monitoring of the changes in the IDLE factor is of extreme importance.
FUEL EFFICIENCY CONSULTING
StorkJet ran an analysis based on what Volotea had been doing in the past, looking at 44 different fuel initiatives. As part of this consultancy, it turned out that Volotea had been performing well in most fields. Because of that StorkJet had to dive deeper to propose new saving opportunities. The final report consisted of ten initiatives with which the airline could receive the highest saving potential. The entire fleet, pilots’ behavior and data from more than 38,000 flights were analyzed. Following that, several goals and targets were set takin into account Vo lotea’s procedures, technical and operational restrictions and feedback from pilots. For example, flights where the single-engine taxi was not allowed were excluded from the analysis. Also, airport-specific conditions, different runways, noise abatement, safety or altitude procedures, were all analyzed. Additionally, feasible crew performance levels were established, to motivate pilots by showing them targets that it is possible to achieve.
The next step was to act on the ‘low hanging fruits’, meaning the fuel initiatives that bring the most savings fastest. Examples of that initiatives are described below. To ensure that implemented changes will be sustained and to react to changes in Volotea’s procedures, conti nuous monitoring is required. StorkJet provides such monitoring and meets with Volotea regularly to discuss the status.
FUEL EFFICIENCY CASES
There are several cases that we can share with you to illustrate performance in practice. Let’s start with the Statistical Taxi Fuel (figure 5.1).
STATISTICAL TAXI FUEL
- Volotea used manual statistical taxi fuel calculation
- Change to summer routes increased planned taxi fuel
- Actual taxi fuel did not change
- FuelPro statistical taxi fuel reflected actual taxi fuel burn
- FuelPro provide day-by day forecast of statistical taxi fuel for each runway
- Plan: IntegrateFuelPro statistical taxi fuel with Flight Planning Software
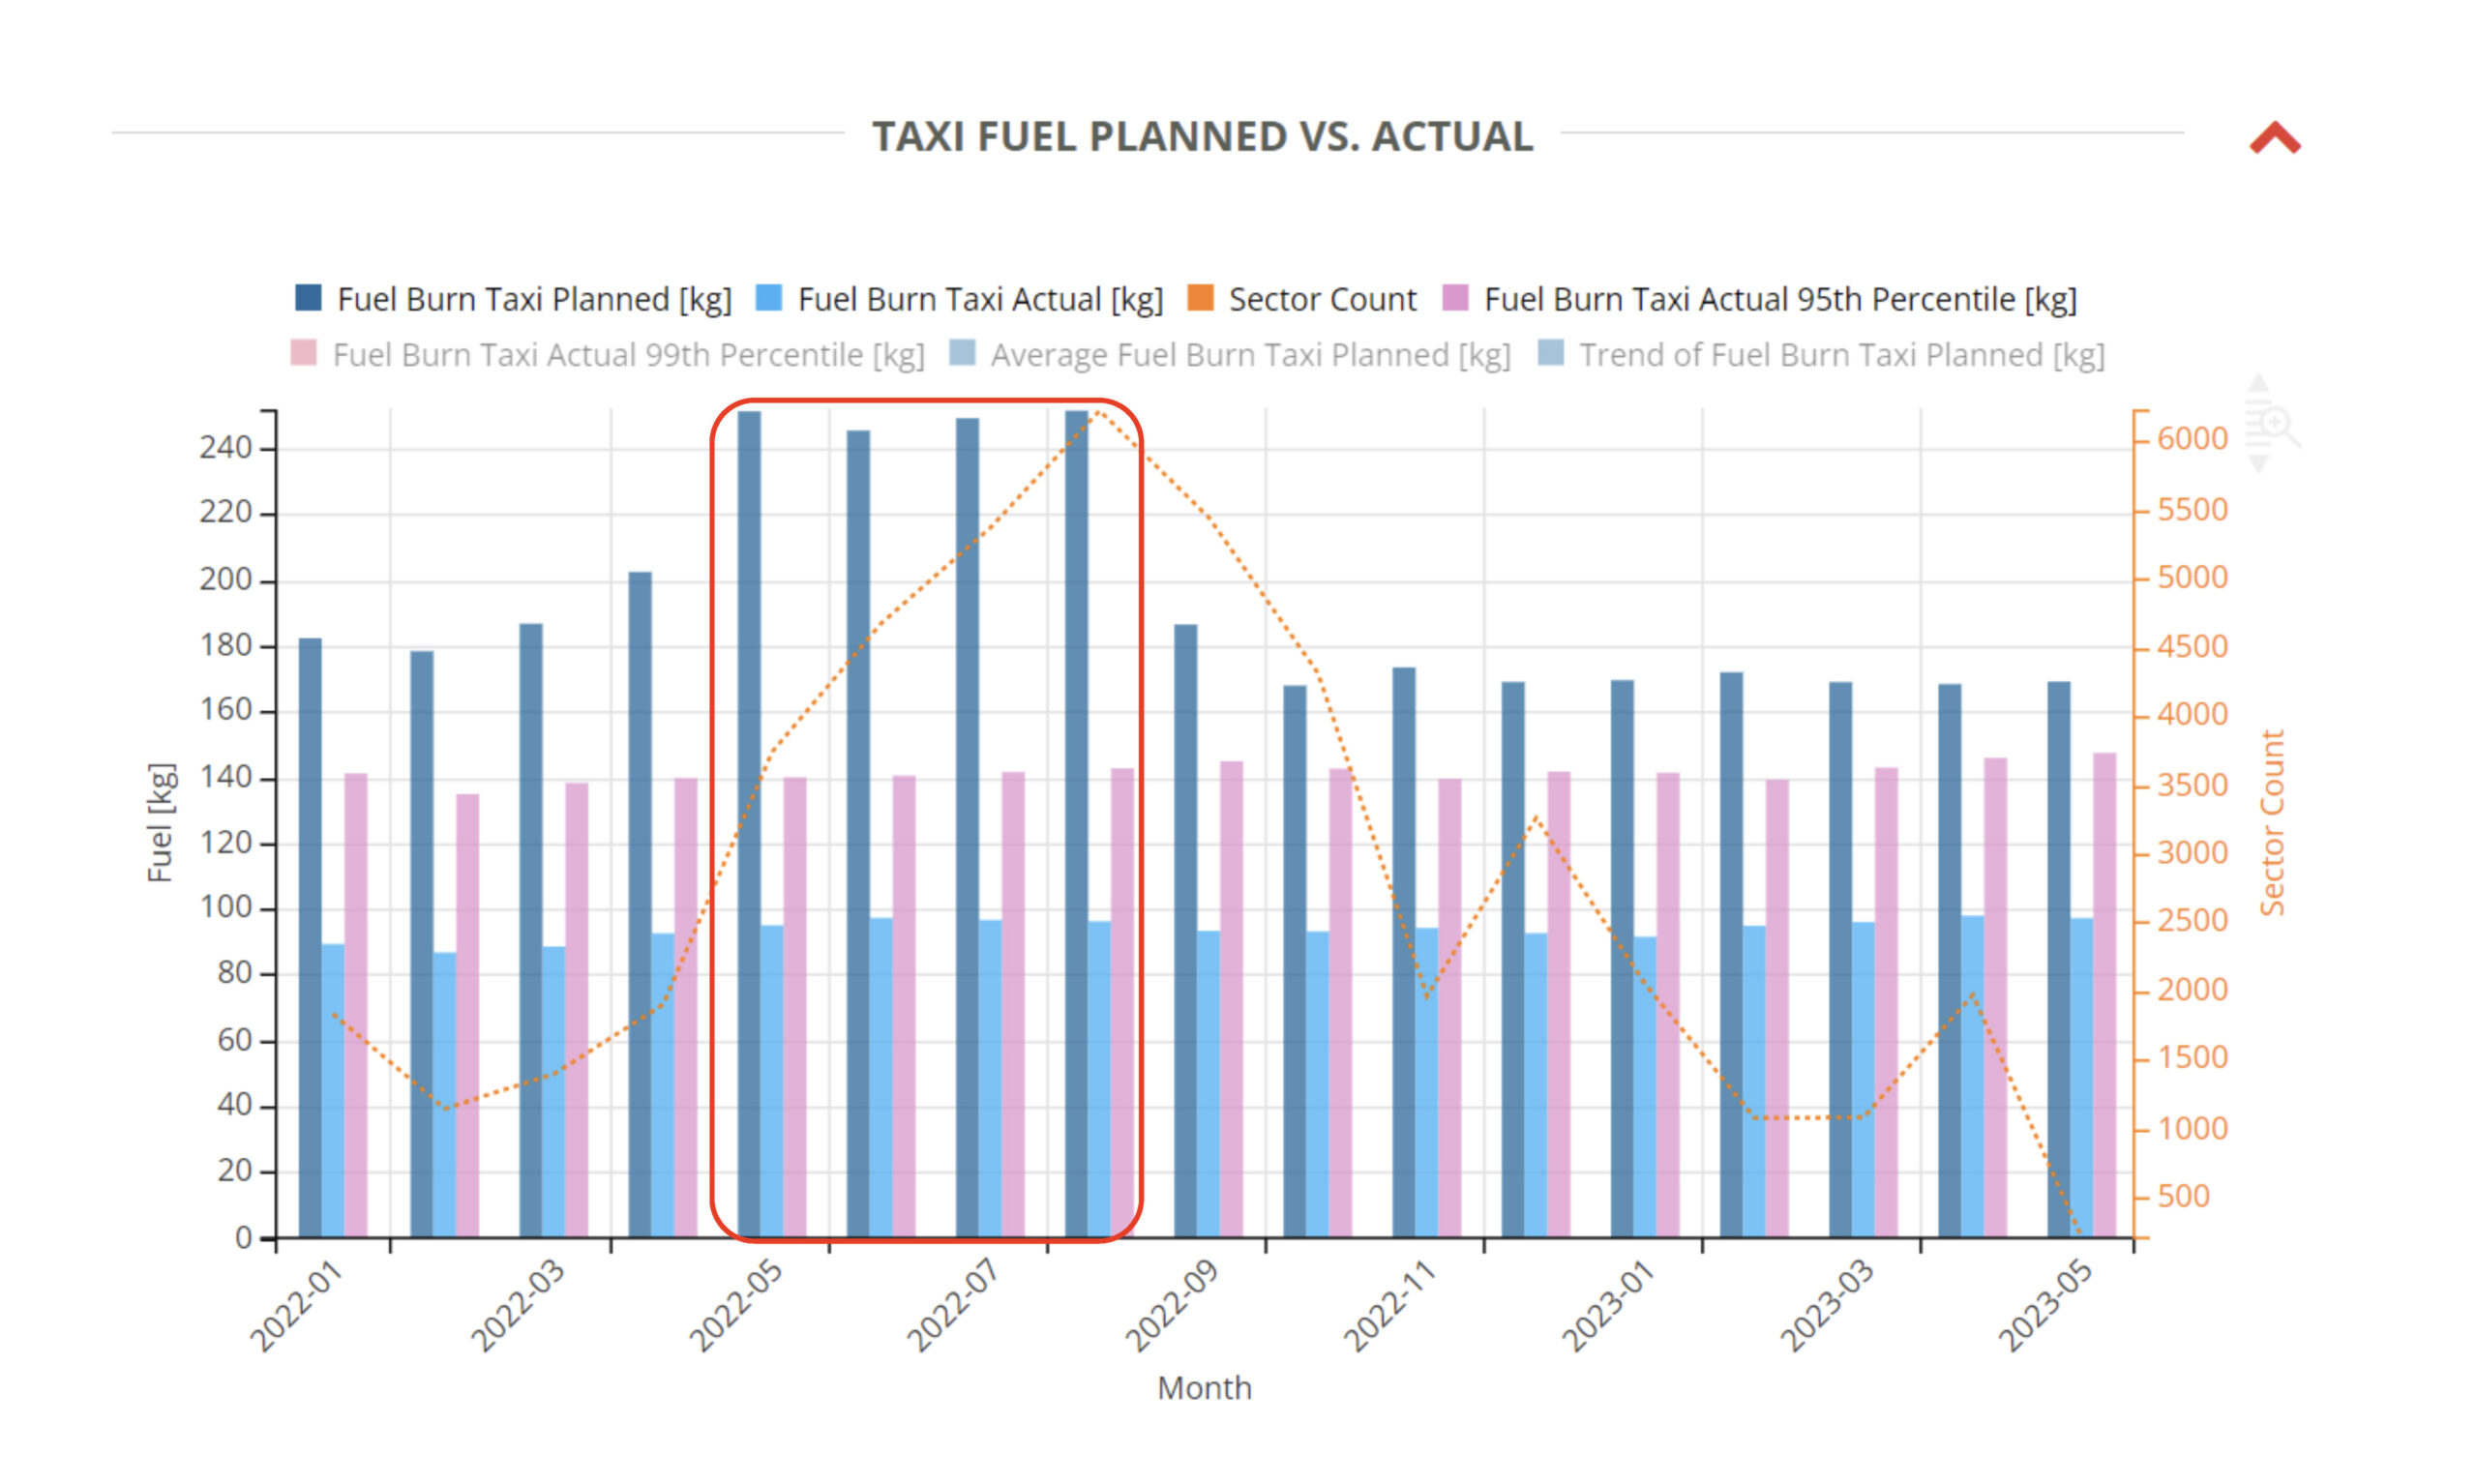
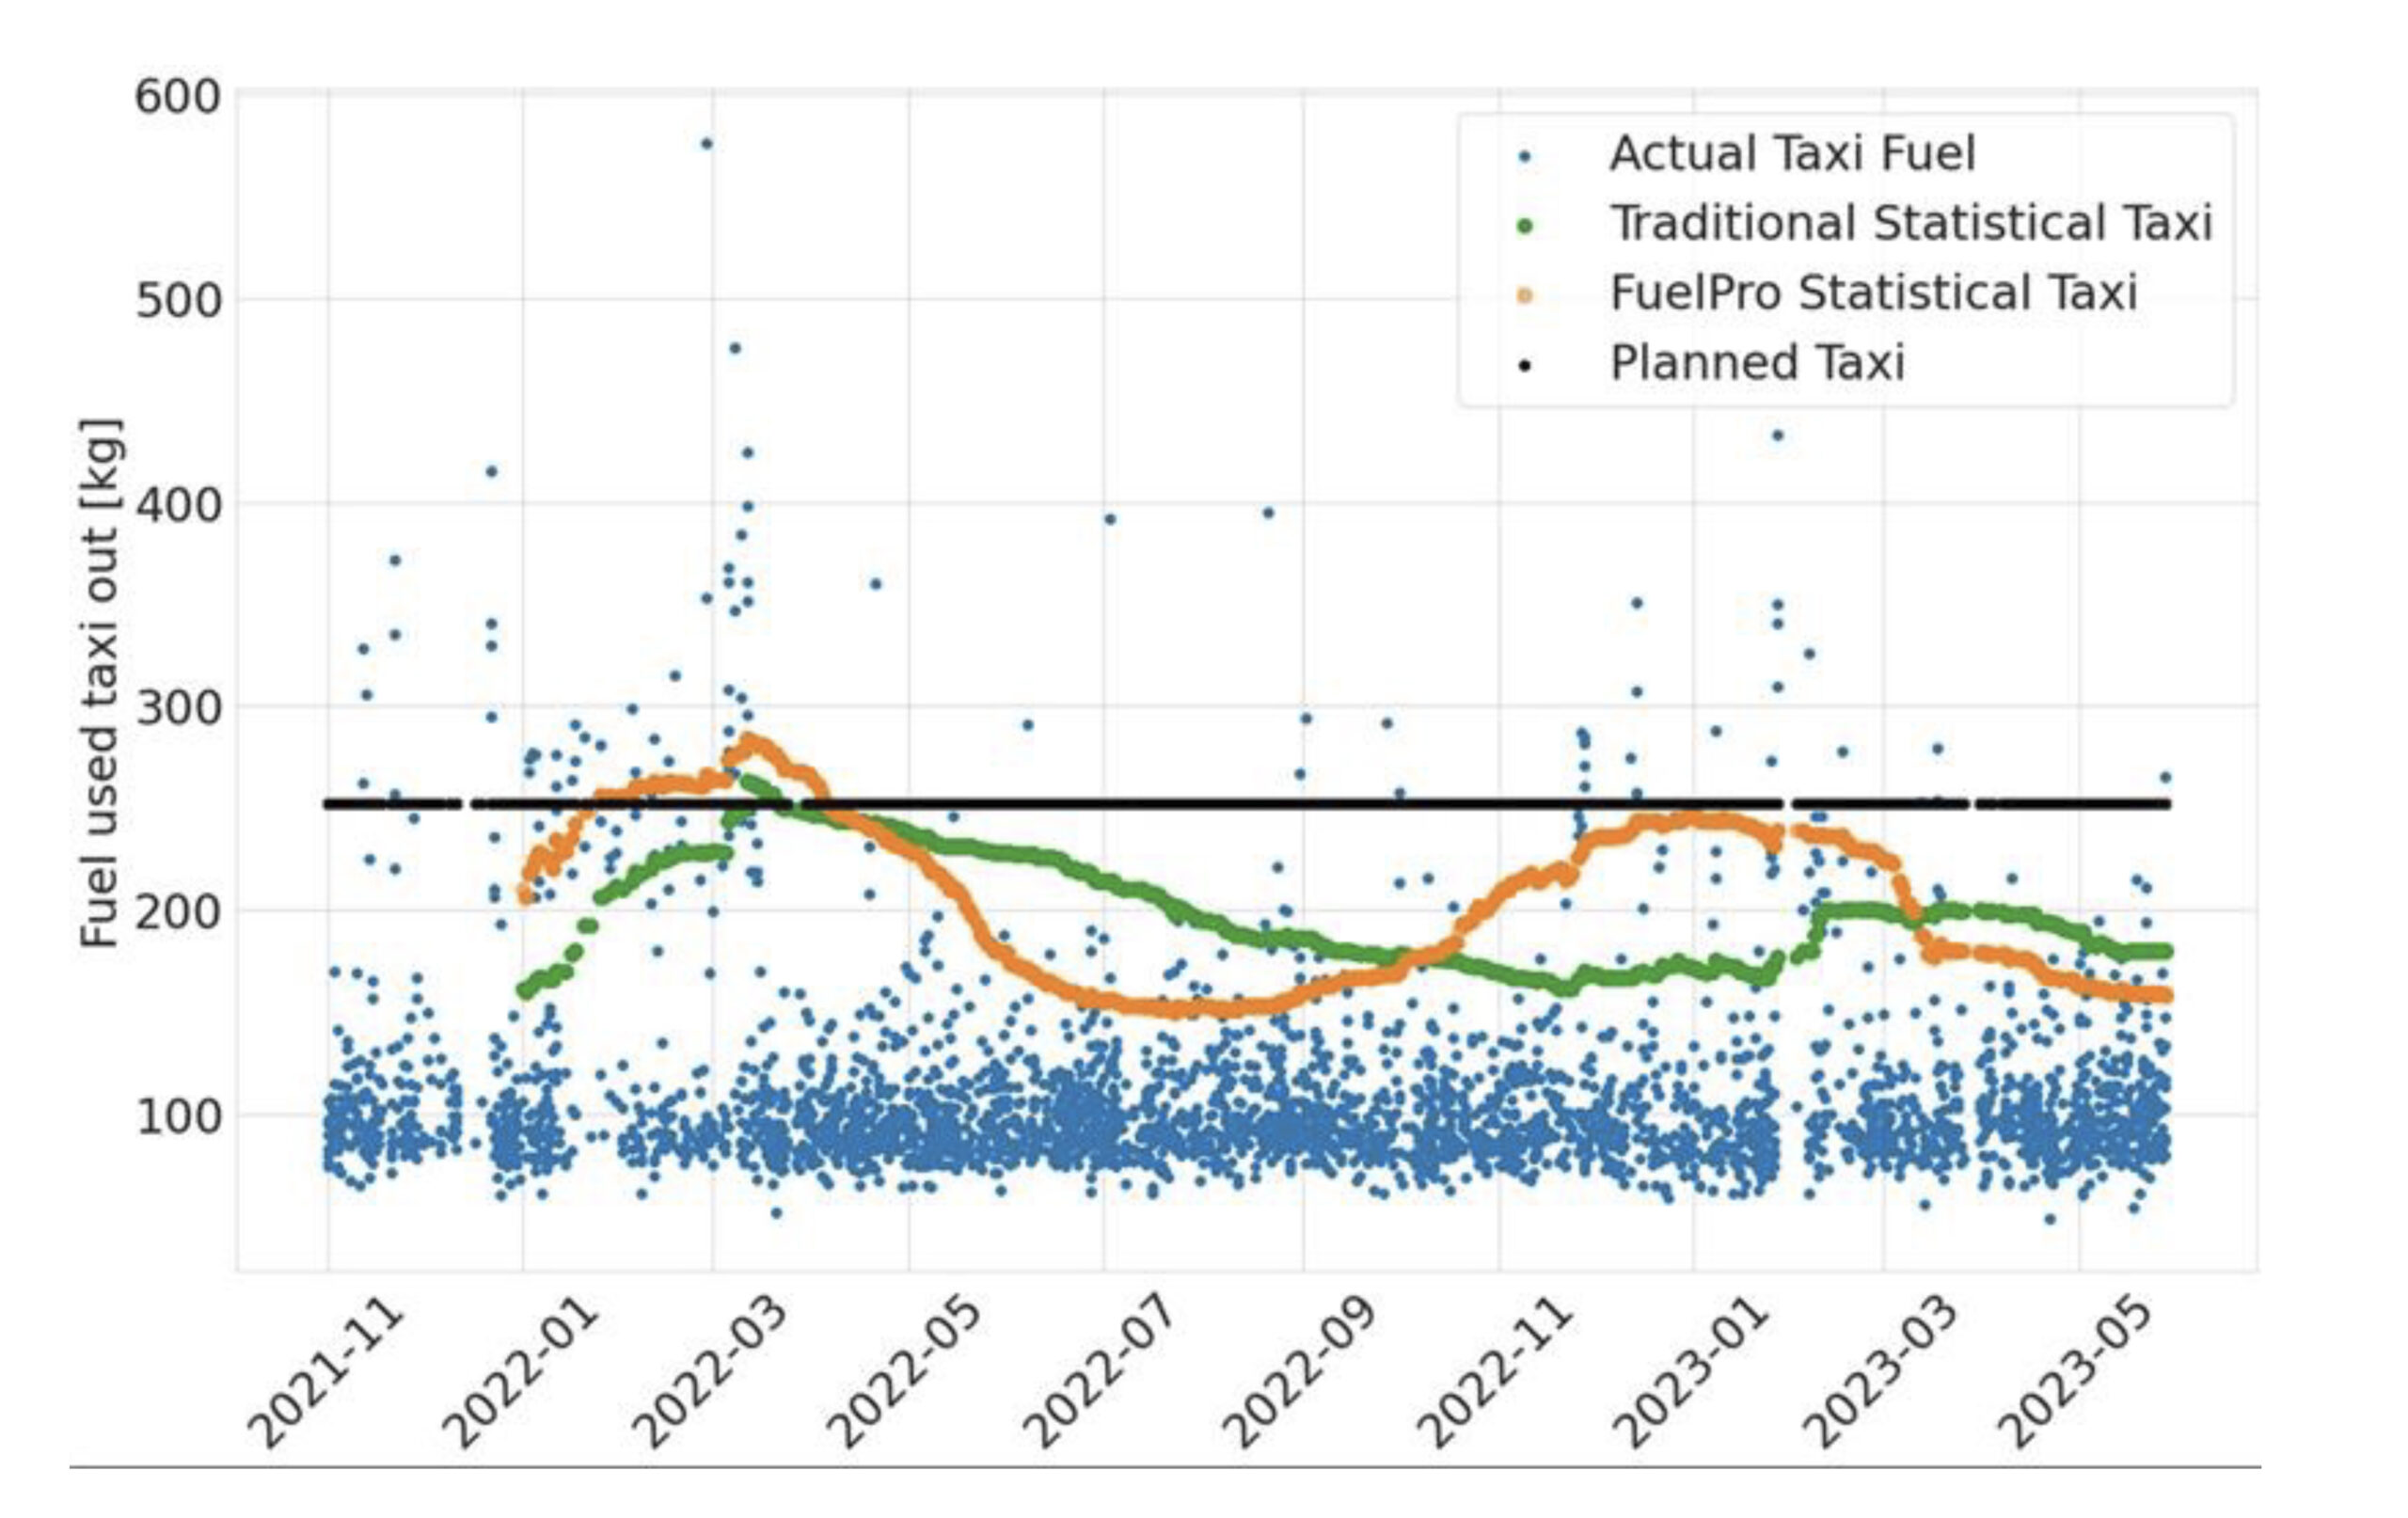
Figure 5.1
Statistical Taxi Fuel is a method of calculating taxi fuel based on the analysis of historical fuel burn during taxi-out for the specific runway, aircraft type, season, day of the week, and time of the day. This way the taxi fuel is computed in the safest and most fuel-efficient way possible. FuelPro provides day-to-day forecasts of taxi fuel for each airport and runway (bottom figure 5.1). Thanks to planned integration with Volotea’s FLIGHTKEYS flight planning system, instead of updating the taxi fuel manually every six months, Volotea will have it done automatically, online by StorkJet, which means that any changes for certain times of the year or weather conditions, will be applied into Volotea’s flight planning system directly, without delay.
ACCELERATION ALTITUDE
Another case identified during the consultancy analysis showed discrepancies in the acceleration altitude: here is an example from the airport in Lyon (figure 5.2).
- Volotea informs pilots about recommended acceleration altitude on OFP
- Policy is set for each runway of each airport according to NADP
- FuelPro allowed to:
-
- Spot airports where airline policy is more conservative than airport
- Improve acceleration altitude policy
- E.g. lower recommendation for LYS
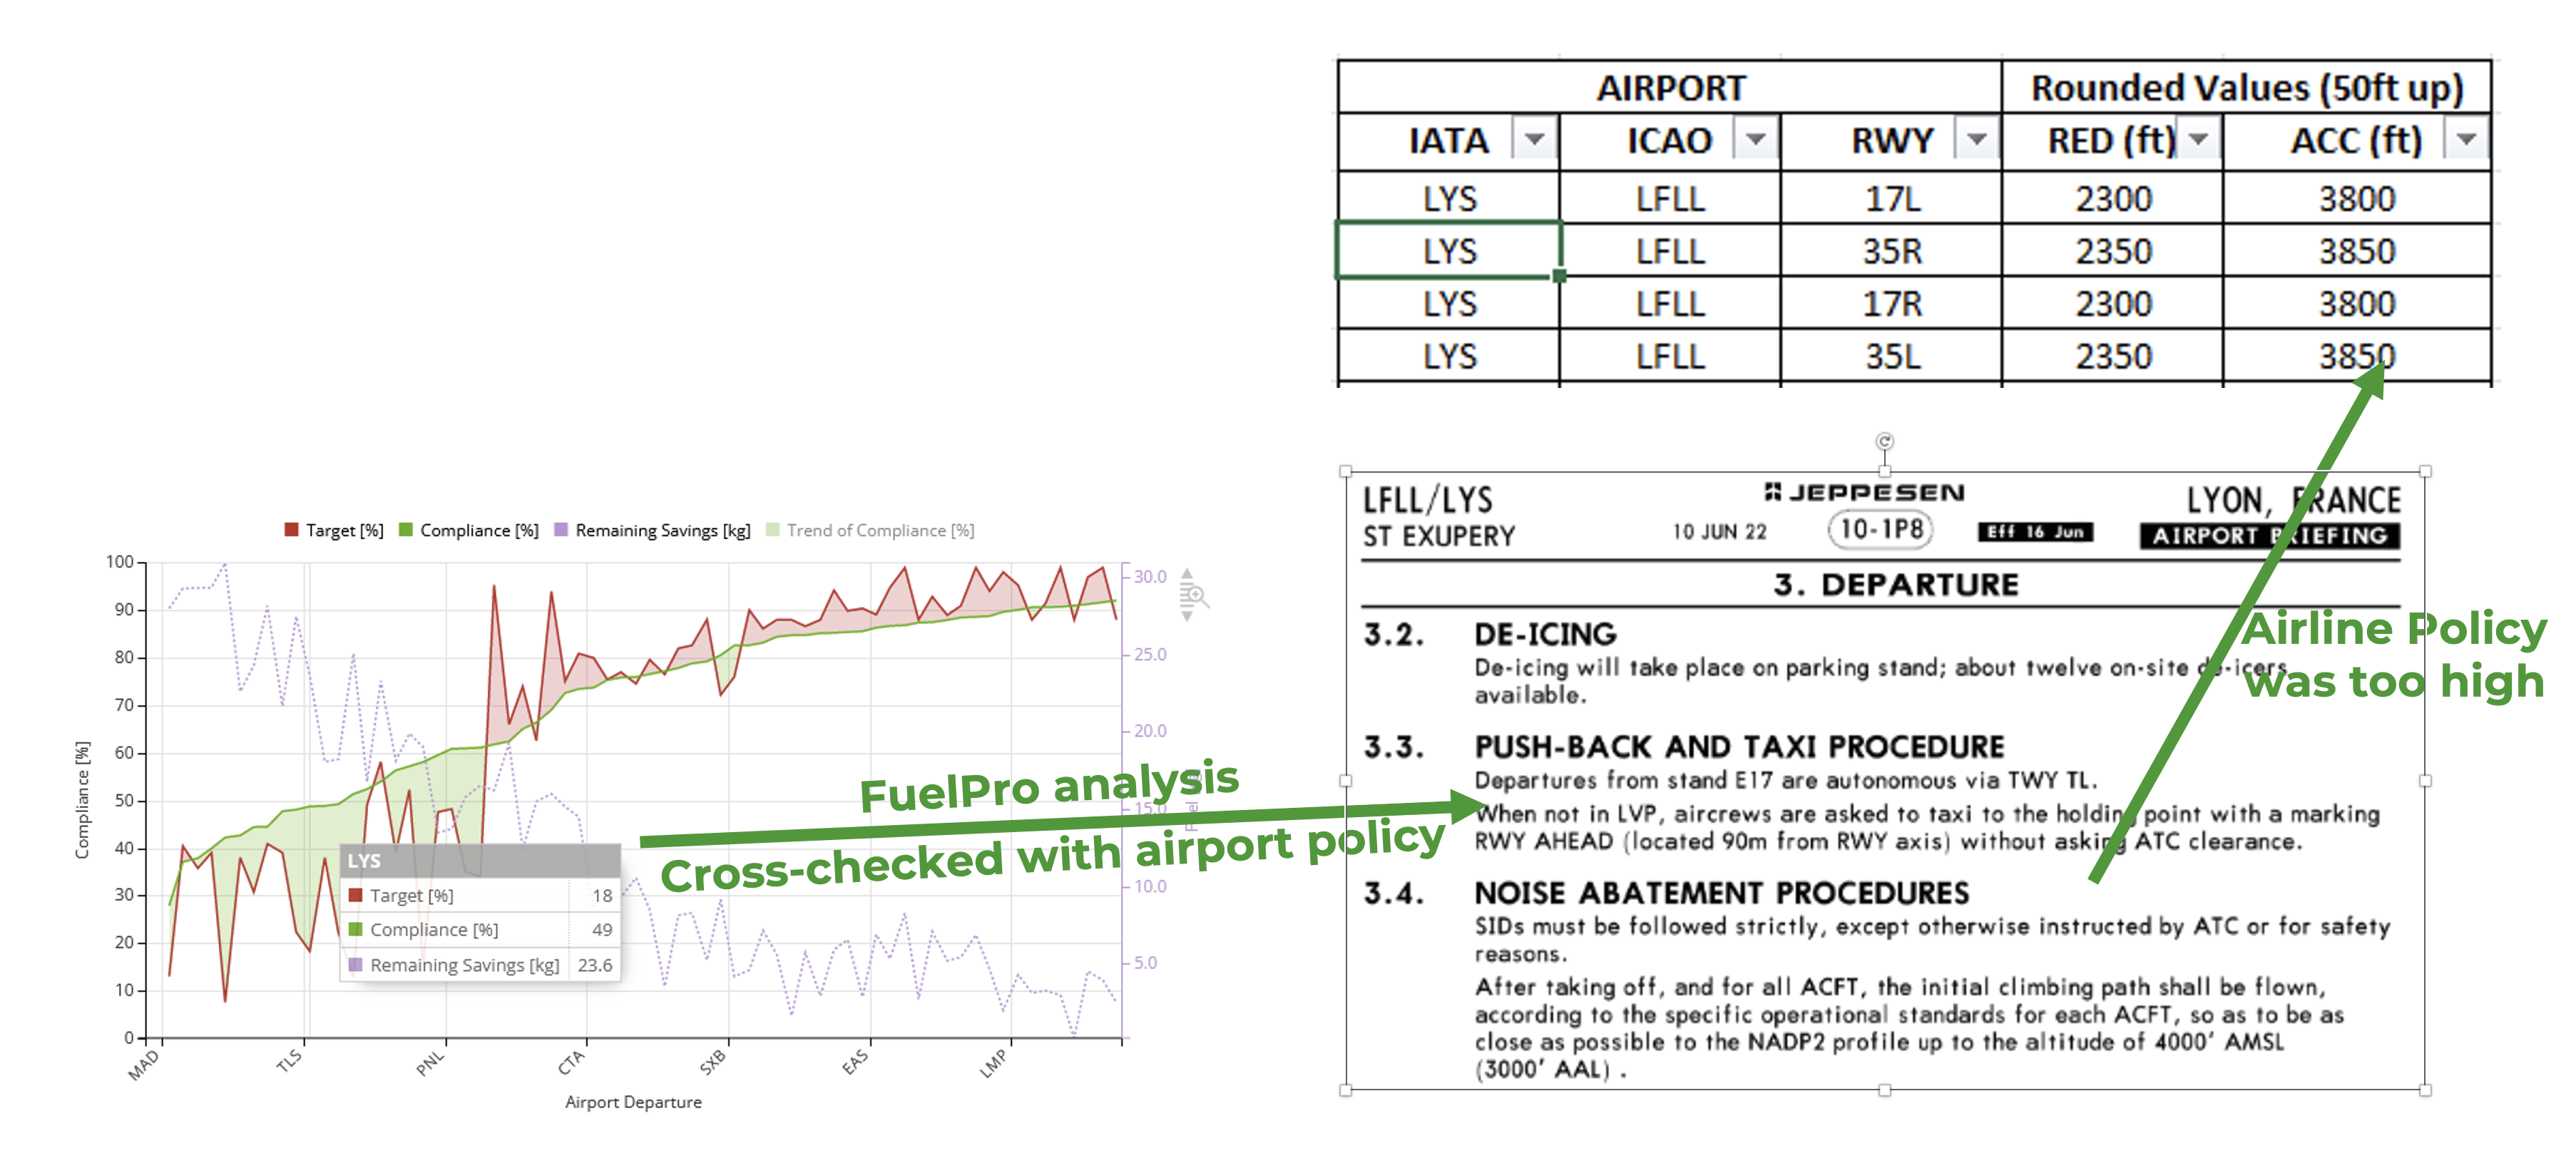
Figure 5.2
The recommended acceleration altitude takes into account local restrictions (including NADP procedures) and aircraft performance limitations. From a fuel efficiency perspective, lower acceleration altitude contributes to reduced fuel consumption — in that case, the flaps are retracted earlier, leading to the reduction of drag, which is the main factor generating increased fuel flow. The interesting thing that was revealed with StorkJet’s FuelPro, was that, for some of the airports, pilots were using much lower acceleration altitude than provided in the Volotea guidelines. The question was: why? Taking Lyon as one of the airports it was detected that there was apparently a simple mistake in Volotea’s data, as the documents were published for the pilots with incorrect NADP (Noise Abatement Procedure). Despite that, some of the pilots were already following actual NADP, which allowed them to accelerate at a lower altitude. When the changes recommended by StorkJet were made, pilots’ compliance to the lower acceleration altitude was even higher and the fuel consumption decreased considerably — around 12kg per each flight from Lyon. Moreover, there were other airports where this was found to be the case. Improving the recommendations for each airport was possible thanks to the FuelPro ‘targets’ feature which is set by StorkJet analysts during implementation for all relevant initiatives.
DELAY MANAGEMENT
Another case is delay management. As a tool to mitigate the delays, Volotea was using high Cost Index. What StorkJet has analyzed, was the impact of this policy on the fuel consumption and the flight time (figure 5.3).
DELAY vs COST OF HIGH-COST INDEX OPERATION
- FuelPro allowed assessing fuel–time tradeoff for delayed operations
- On average using a high cost index to reduce delay causes:
-
- 250 kg/flight of additional fuel burn
- 6-7 minutes shorter flight time
- Analysis of the number of flights within:
-
- EC-261 threshold
- Airport curfews
- Pilots’ flight time limits
Allows for better delay management
The fuel-time tradeoff of high-cost index flights compared with the standard cost index as a function of distance
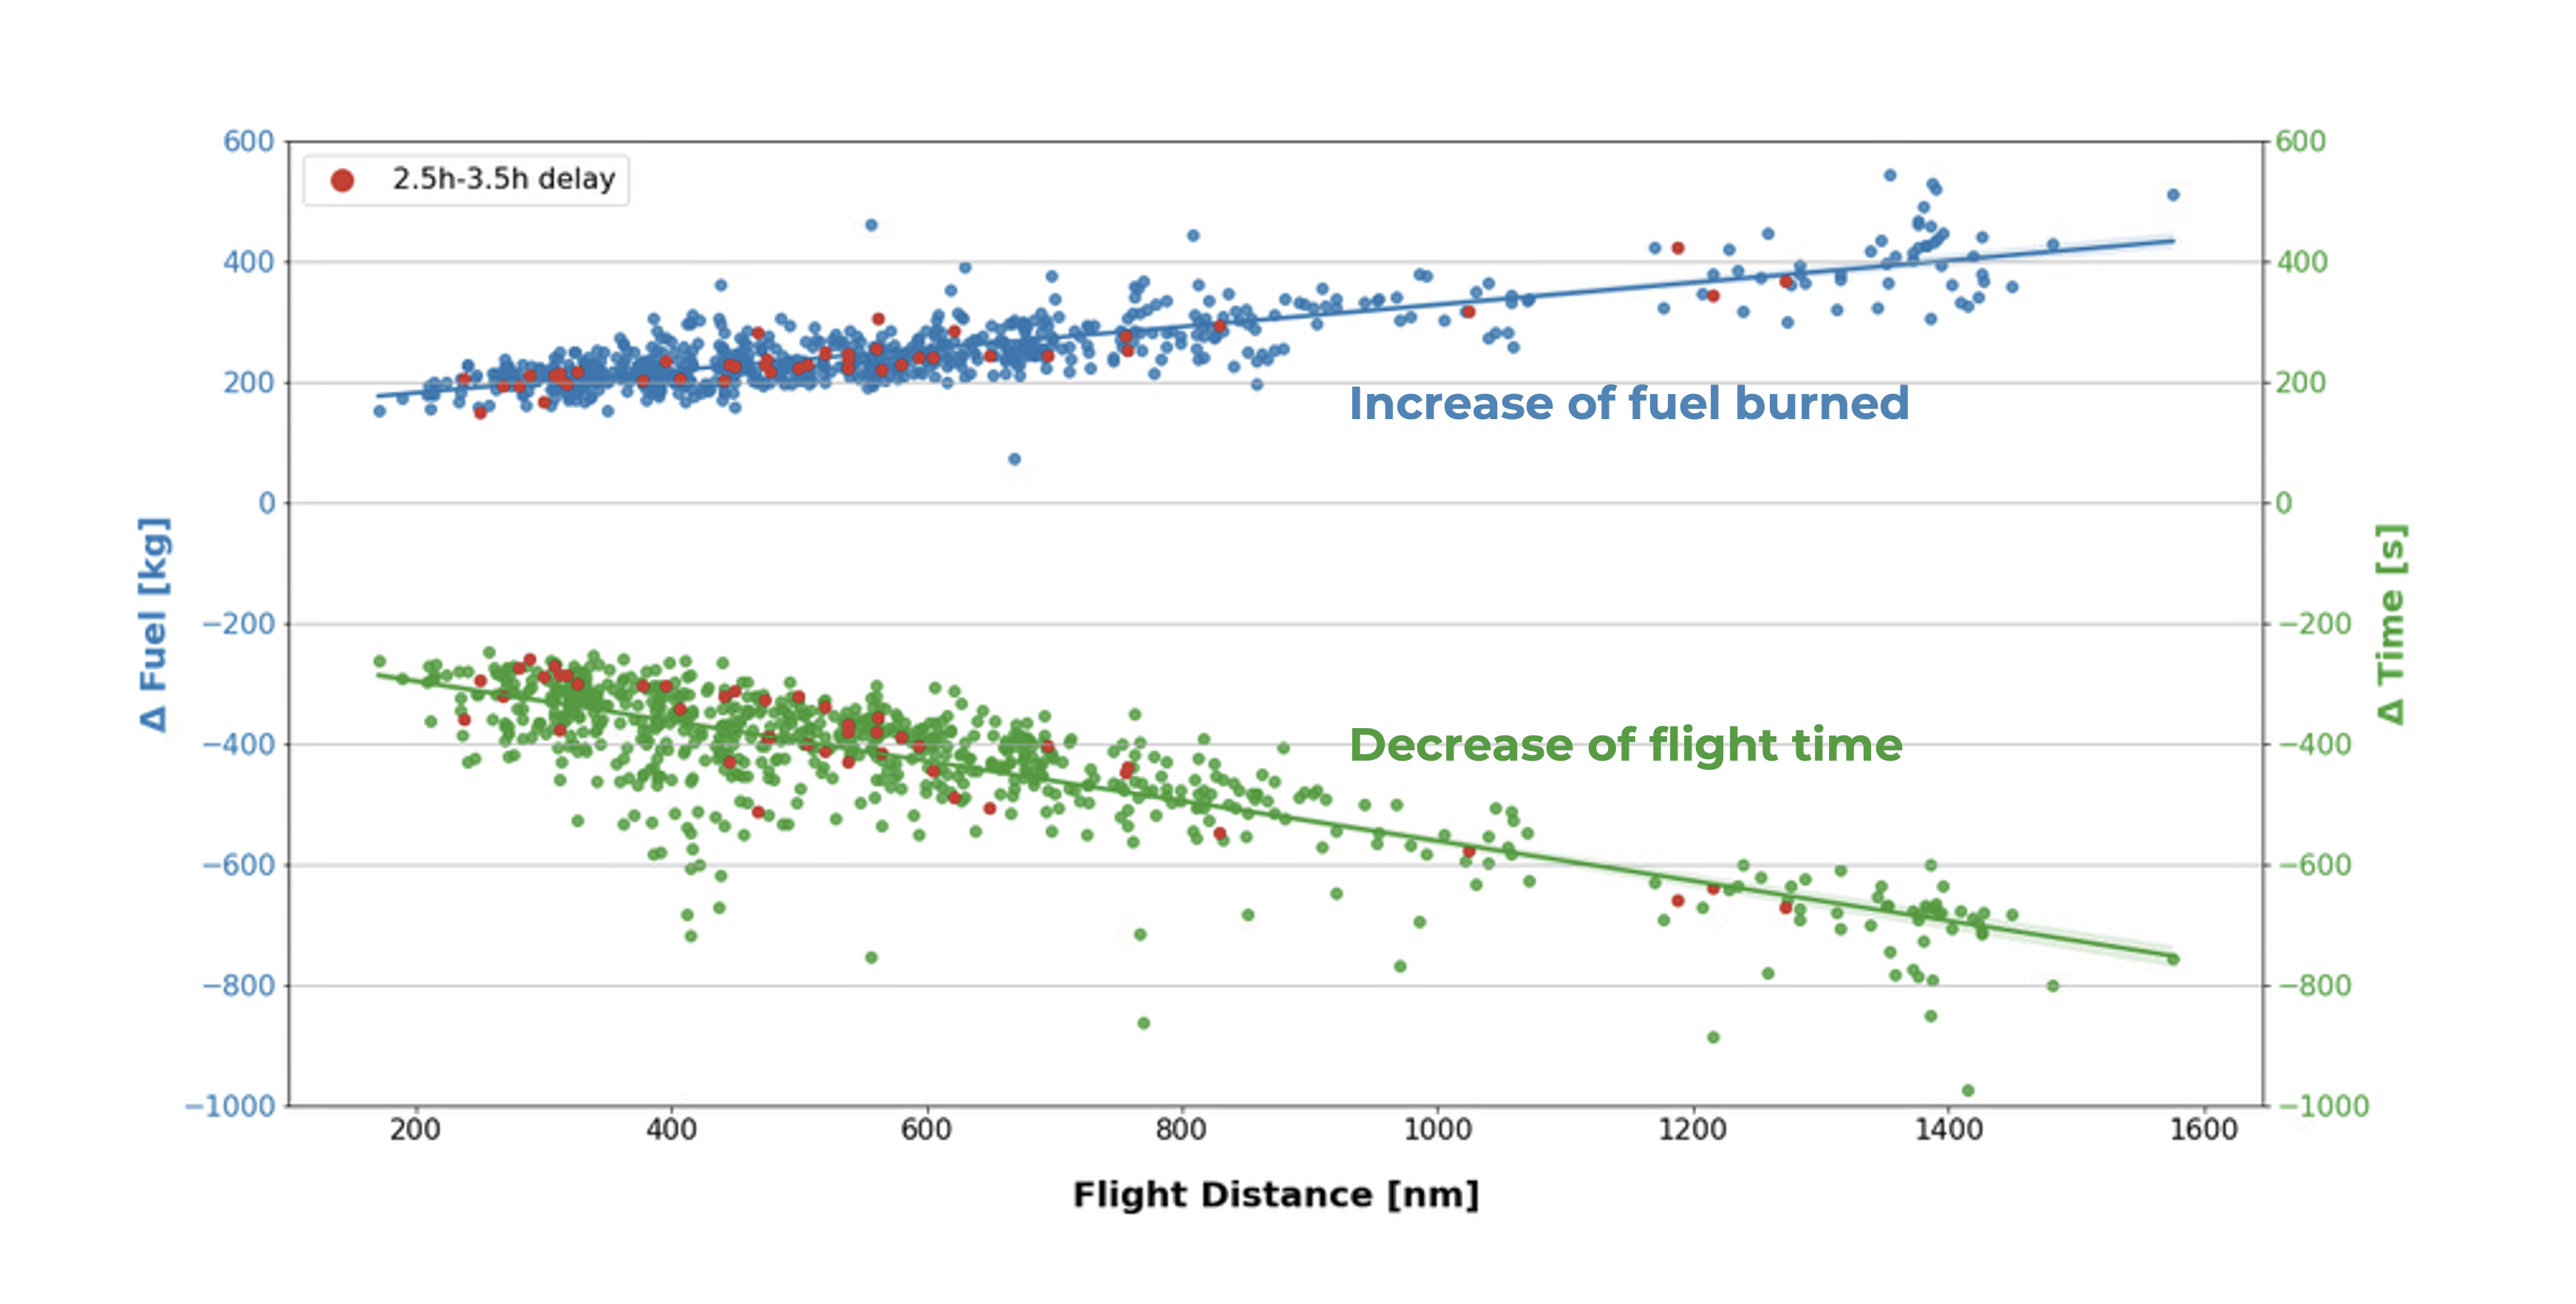
Figure 5.3
The main goal was to simulate how fuel consumption and flight time would change with a different Cost Index. The increase in fuel consumption on ‘high Cost Index’ flights, compared with the one on ‘standard Cost Index’ flights was analyzed, in the function of flight distance. The same process was applied to the flight time analysis. It was discovered that, for each „high Cost Index” flight Volotea could save on average 250kg of fuel by extending the flight time by around six to seven minutes. For shorter flights, as the chart shows, the penalty is even higher, as less time is saved and additional fuel is burned anyhow. Analyses were also made of how many flights using the ‘high Cost Index’ went below the threshold of EC261, airport curfews or the pilots’ flight time limits. The results revealed that there were very few flights that matched those conditions, and for most of them, the delay costs would be incurred anyhow (even if the flight was flown seven minutes faster), while there was a saving of 250kg of fuel per flight. As a result of StorkJet’s analysis, Volotea has amended its delay management procedures accordingly to realize those savings.
TANKERING
Another case is tankering, whose rate has changed significantly since the implementation of FuelPro (figure 5.4).
TANKERING FUEL PLANNING
- Since the implementation of FuelPro, the rate of tankering has increased from 55 % to 80%.
- Tankering generated 5 000 000 USD in savings in year 2022.
- If current level of tankering is maintained, estimated savings for year 2023 are 7 700 000 USD.
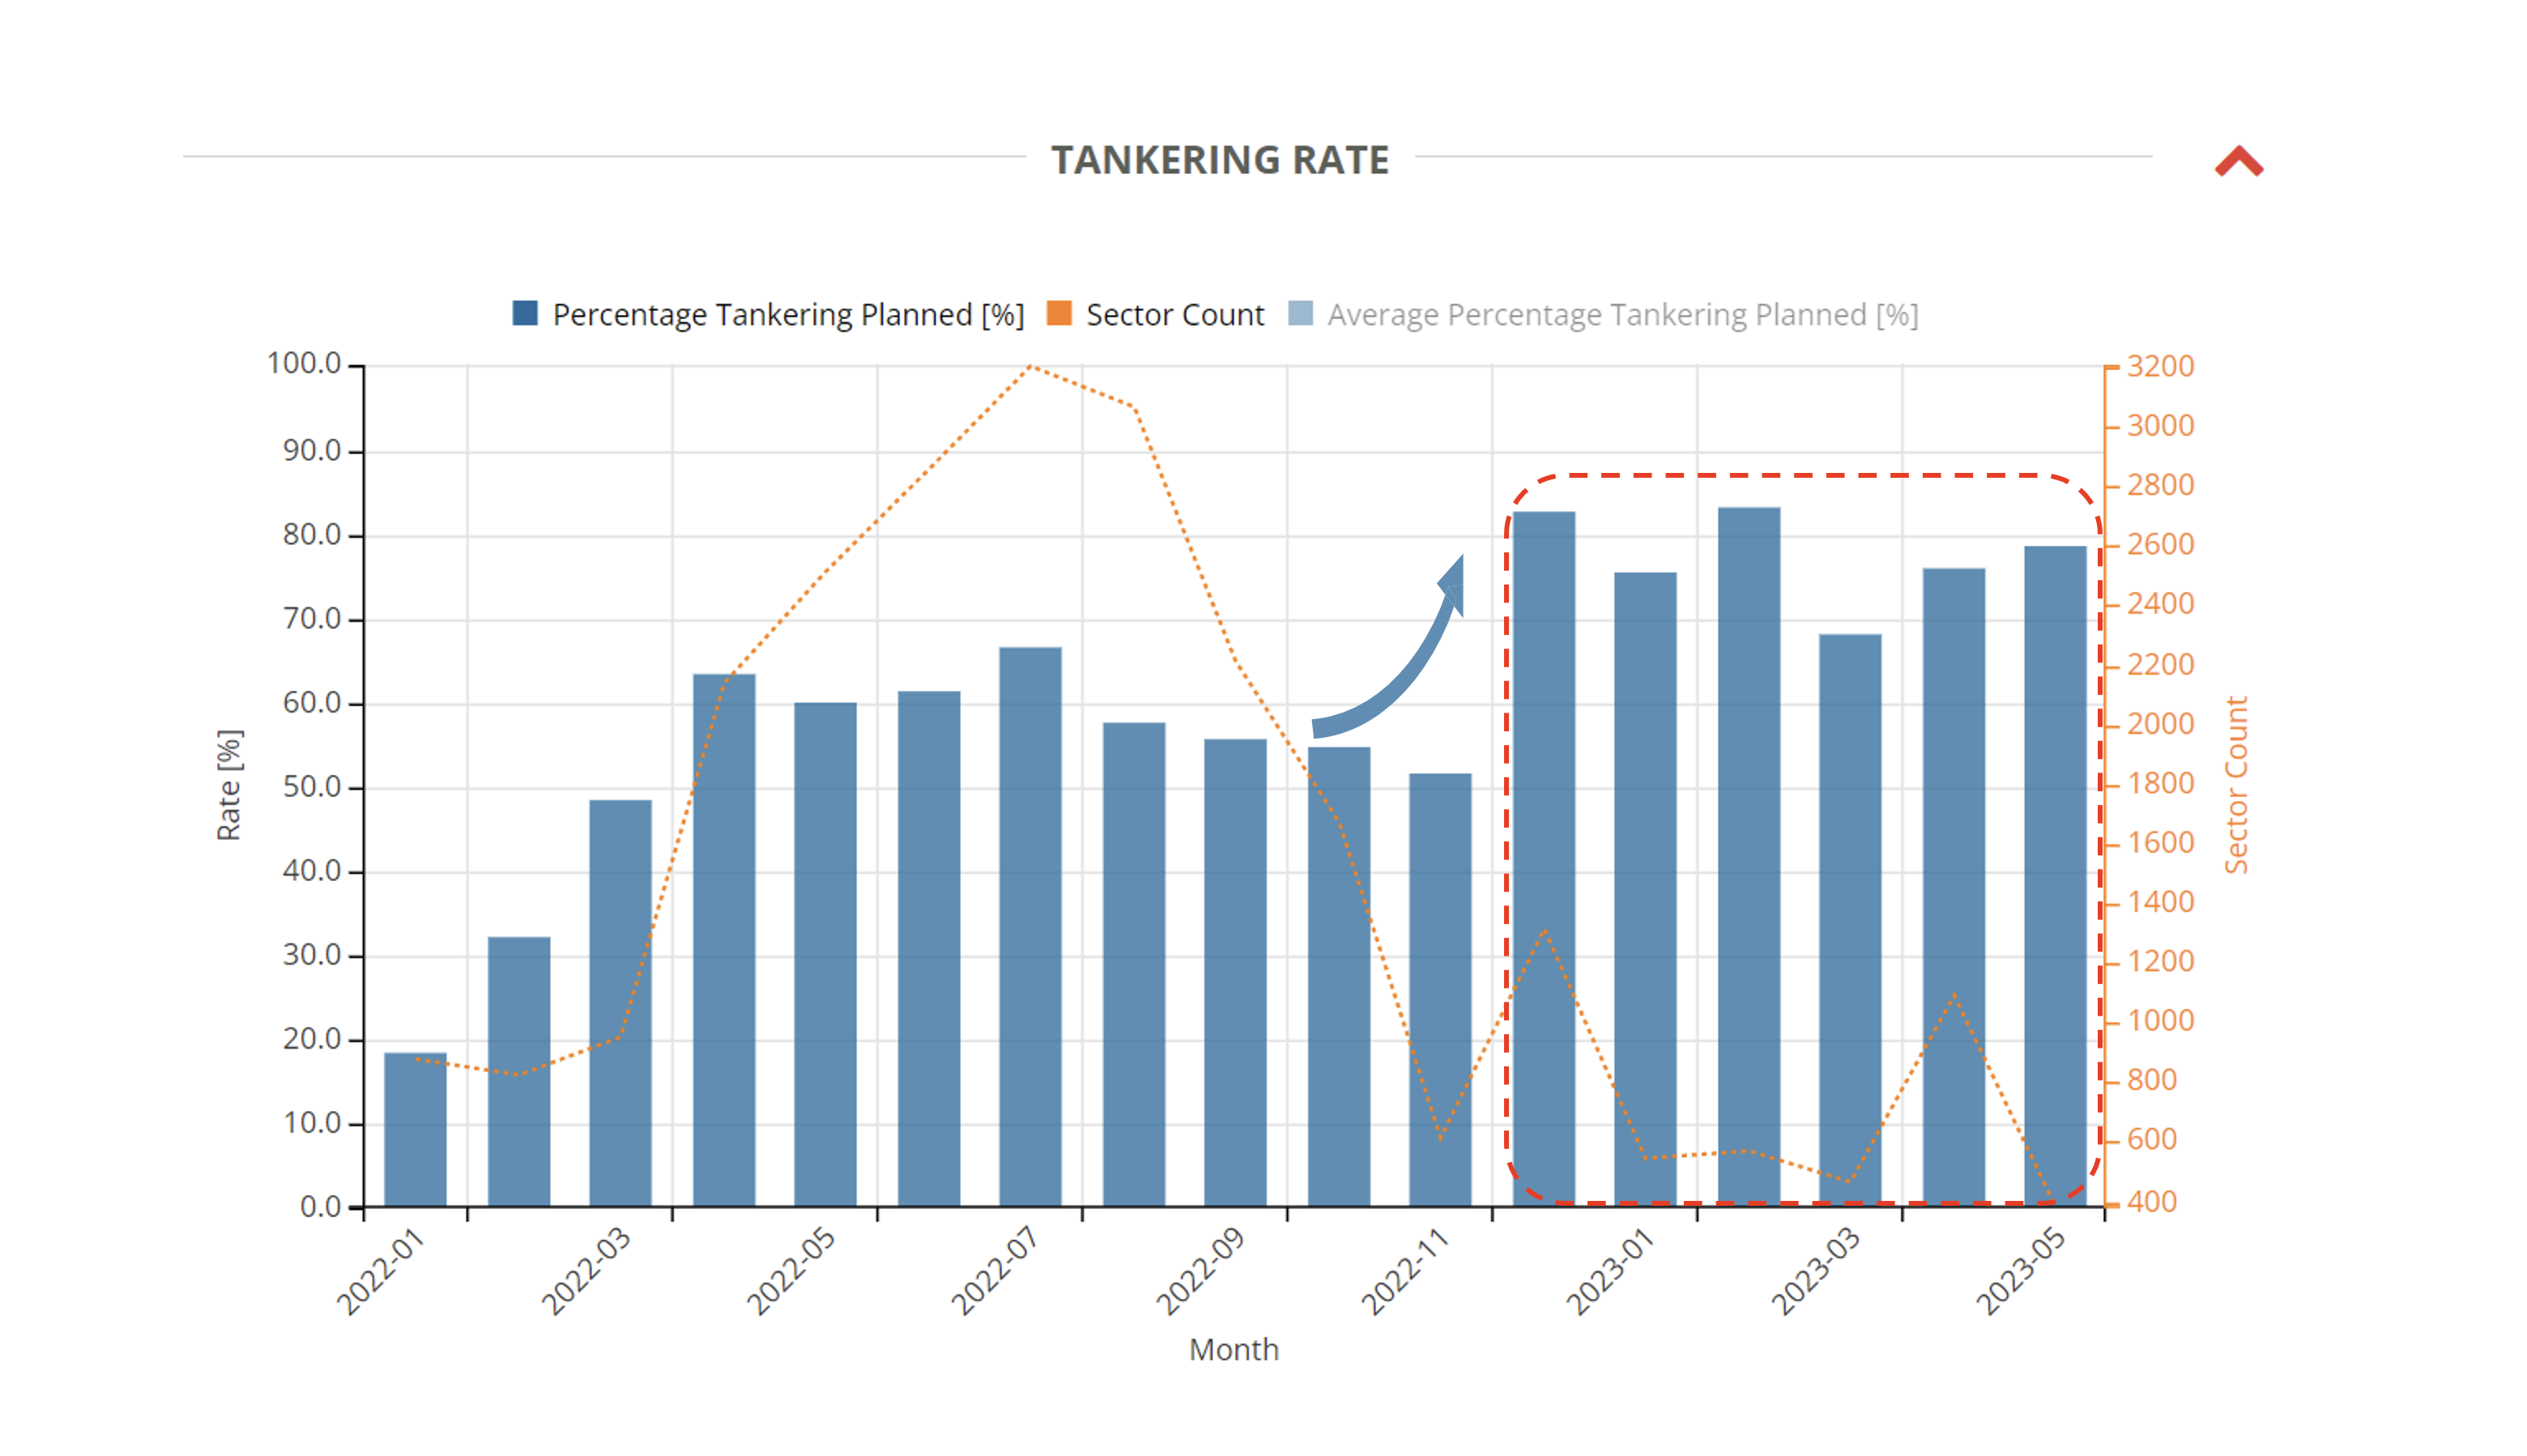

Figure 5.4
Fuel tankering is performed in order to avoid the uplift of expensive fuel at the destination. Volotea had been applying tankering to flights before the launch of FuelPro, but after the implementation of this tool and proper analysis related to the profitability of tankering on specific sectors, its rate has increased significantly. In Volotea, tankering made it possible to generate savings of 5,000,000 USD in 2022. If the trend is maintained, the estimated savings for the year 2023 are 7,700,000 USD. It is worth mentioning that the increase of tankering rate to the current level, due to higher fuel consumption in flight, has led to a growth of 0.95 percent in the total yearly CO2 footprint generated by Volotea’s fleet. However, tankering savings made it possible to reduce fuel costs by 3%. As a result, with more frequent tankering, we see a much higher contribution of fuel cost reductions rather than the increase of CO2 footprint or extra costs resulting from CORSIA/ETS emission charges. Moreover, since its foundation, Volotea has carried out various sustainability projects, thanks to which the carbon footprint per passenger-kilometer was reduced by more than 40% and is now offsetting its current total carbon emissions by 5%, aiming to reach a 25% reduction in CO2 footprint by 2025. Considering such a high environmental awareness among Volotea’s community, the airline would be able to allocate part of the savings from tankering for purposes related to environmental protection currently in progress: for instance, further support in the process of development and distribution of SAF (Sustainable Aviation Fuel). With the help of FuelPro, tankering can be optimized to the most efficient level achievable.
PILOTS’ APP AS A HELP IN FLIGHT MANAGEMENT
Another milestone which Volotea has made in cooperation with StorkJet, was the implementation of FlyGuide — an EFB App available on every Volotea pilot’s iPad (figure 6.1).
FLYGUIDE – PILOTS’ APP ON EFB
FlyGuide enables pilots to operate safely and efficiently, while empowering them to make more informed decisions.
- Fuel Briefing to help pilots prepare for the flight
- Fuel Scores after the flight to educate about past performance
- Engaging manuals and tips how to improve
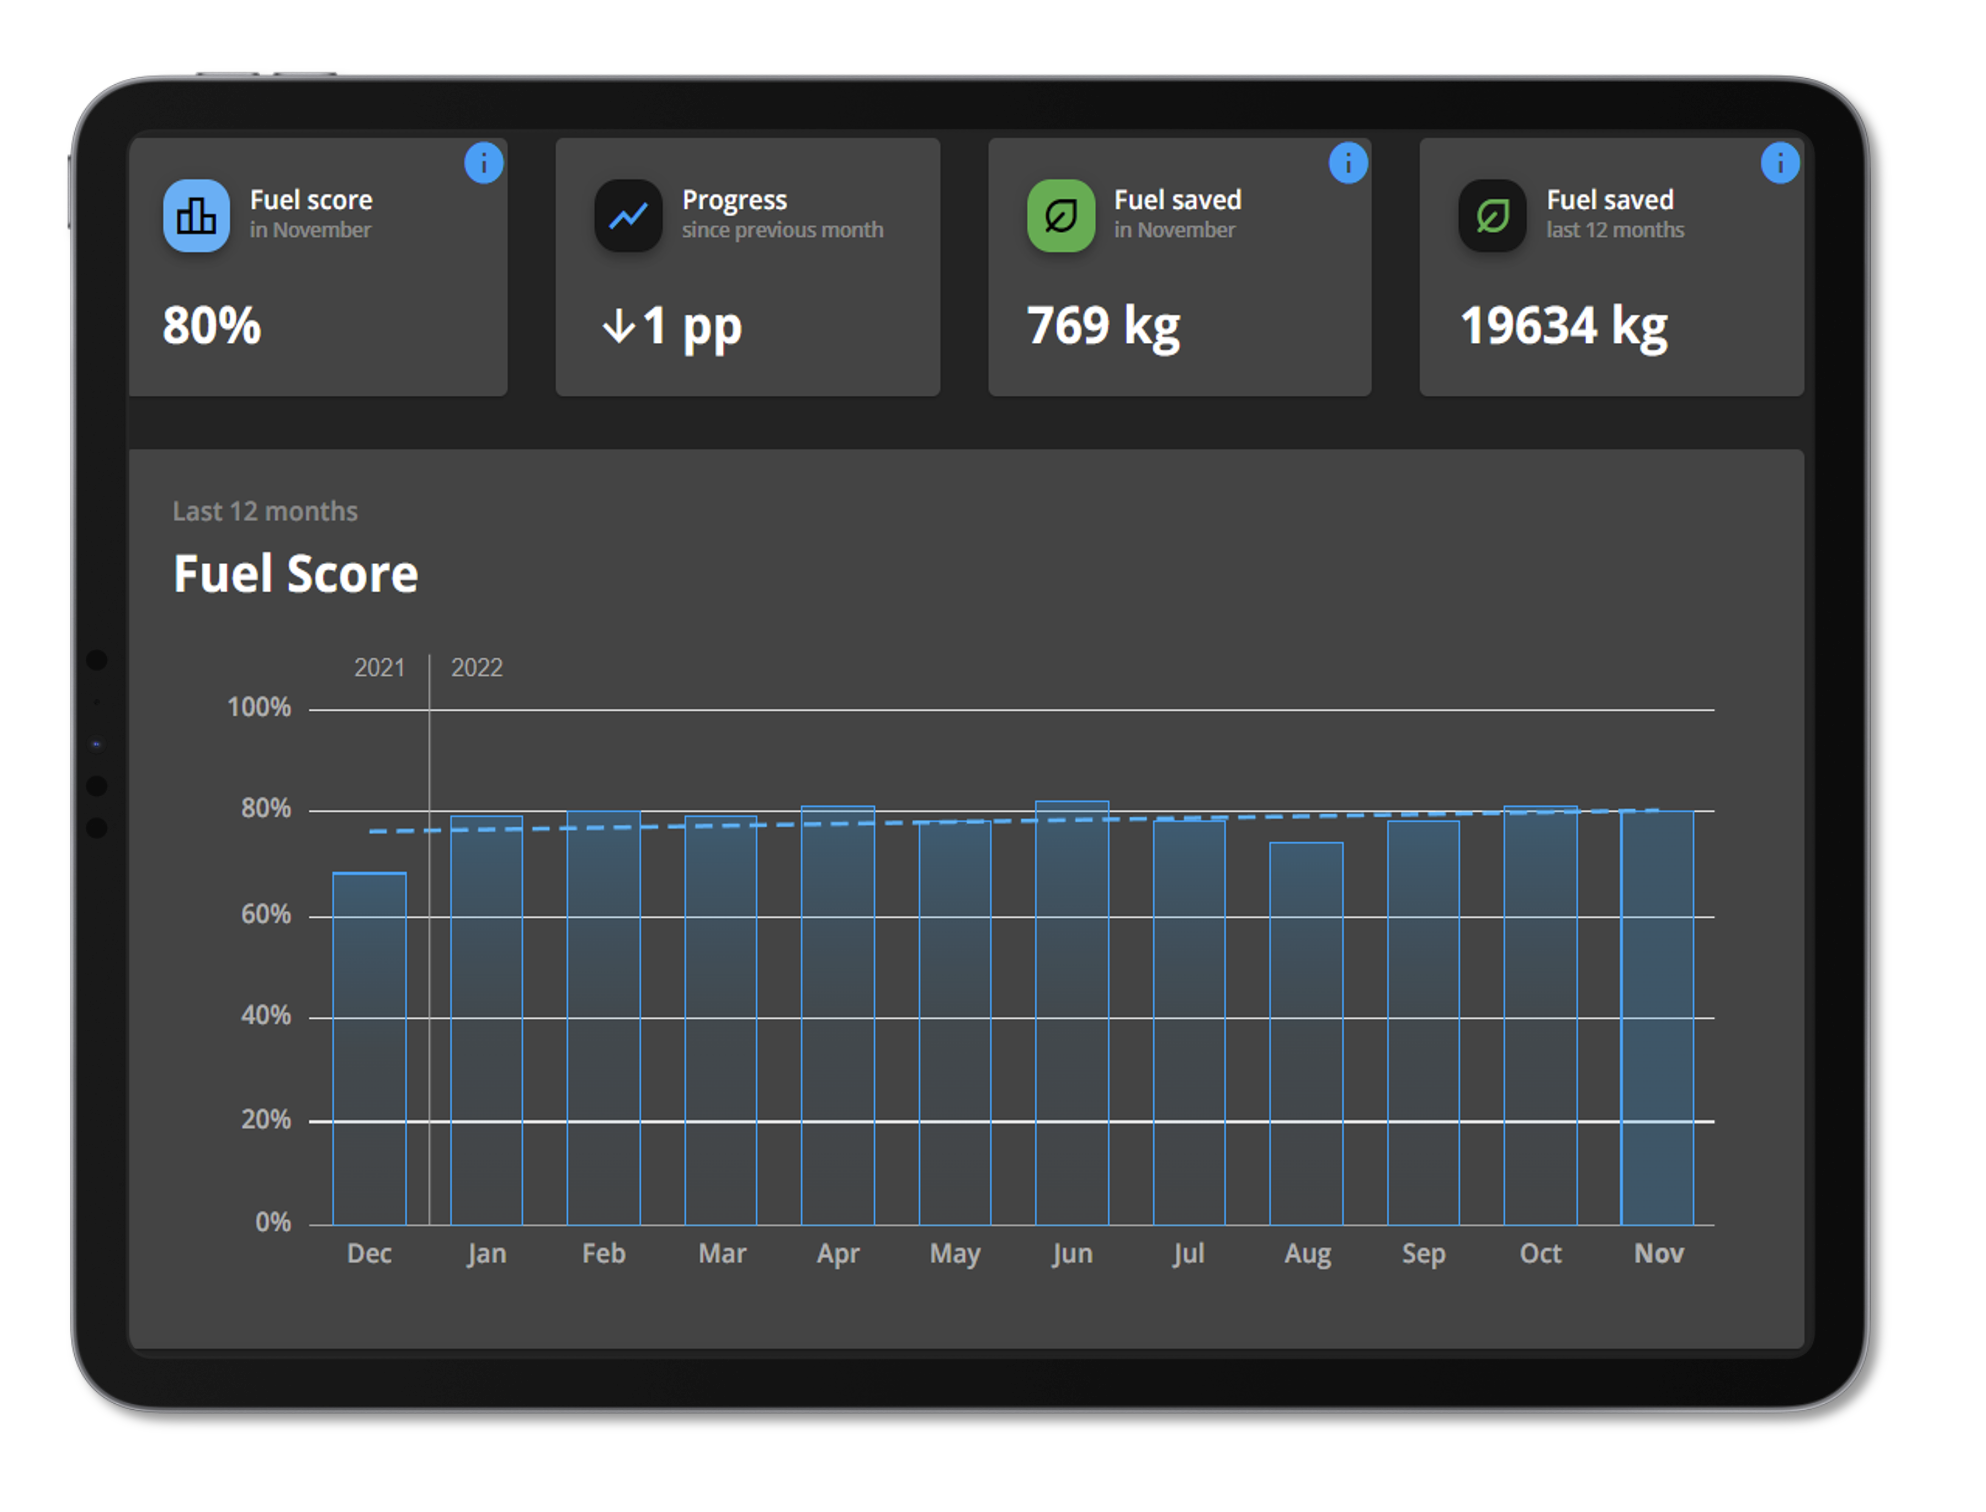
Figure 6.1
FlyGuide, at first provides the pilots with intuitive and reliable insights to help prepare for the flight, improve flight management and fuel efficiency. It shows historical fuel burn compared to the flight plan, gives guidance on single engine taxi in and out, as well as assists the pilots to select the best departure and landing configuration for the aircraft, taking into account where the runway is, plus how that affects taxi time and taxi fuel. Next, after the flight, pilots can see their data and check how well have they managed to contribute to savings in the initiatives chosen for them by Volotea. All of this is combined with Volotea’s manuals and FlyGuide’s Knowledge Base showing pilots some tips on how to improve their own performance.
FLYGUIDE USE CASES BASED ON FUEL BRIEFING FUNCTION
There are several cases, where Fuel Briefing function in FlyGuide might be useful and may help pilots in the decision-making process, as well as in-flight management. The first example is presented in figure 6.2.
FLYGUIDE FUEL BRIEFING USE CASE – FUEL DECISIONS
- Useful to understand conditions at new or unfamiliar airports to prepare for an upcoming flight.
- Review historical data regarding fuel consumption on specific flight to support pre-flight discretionary fuel decisions and departure briefings.
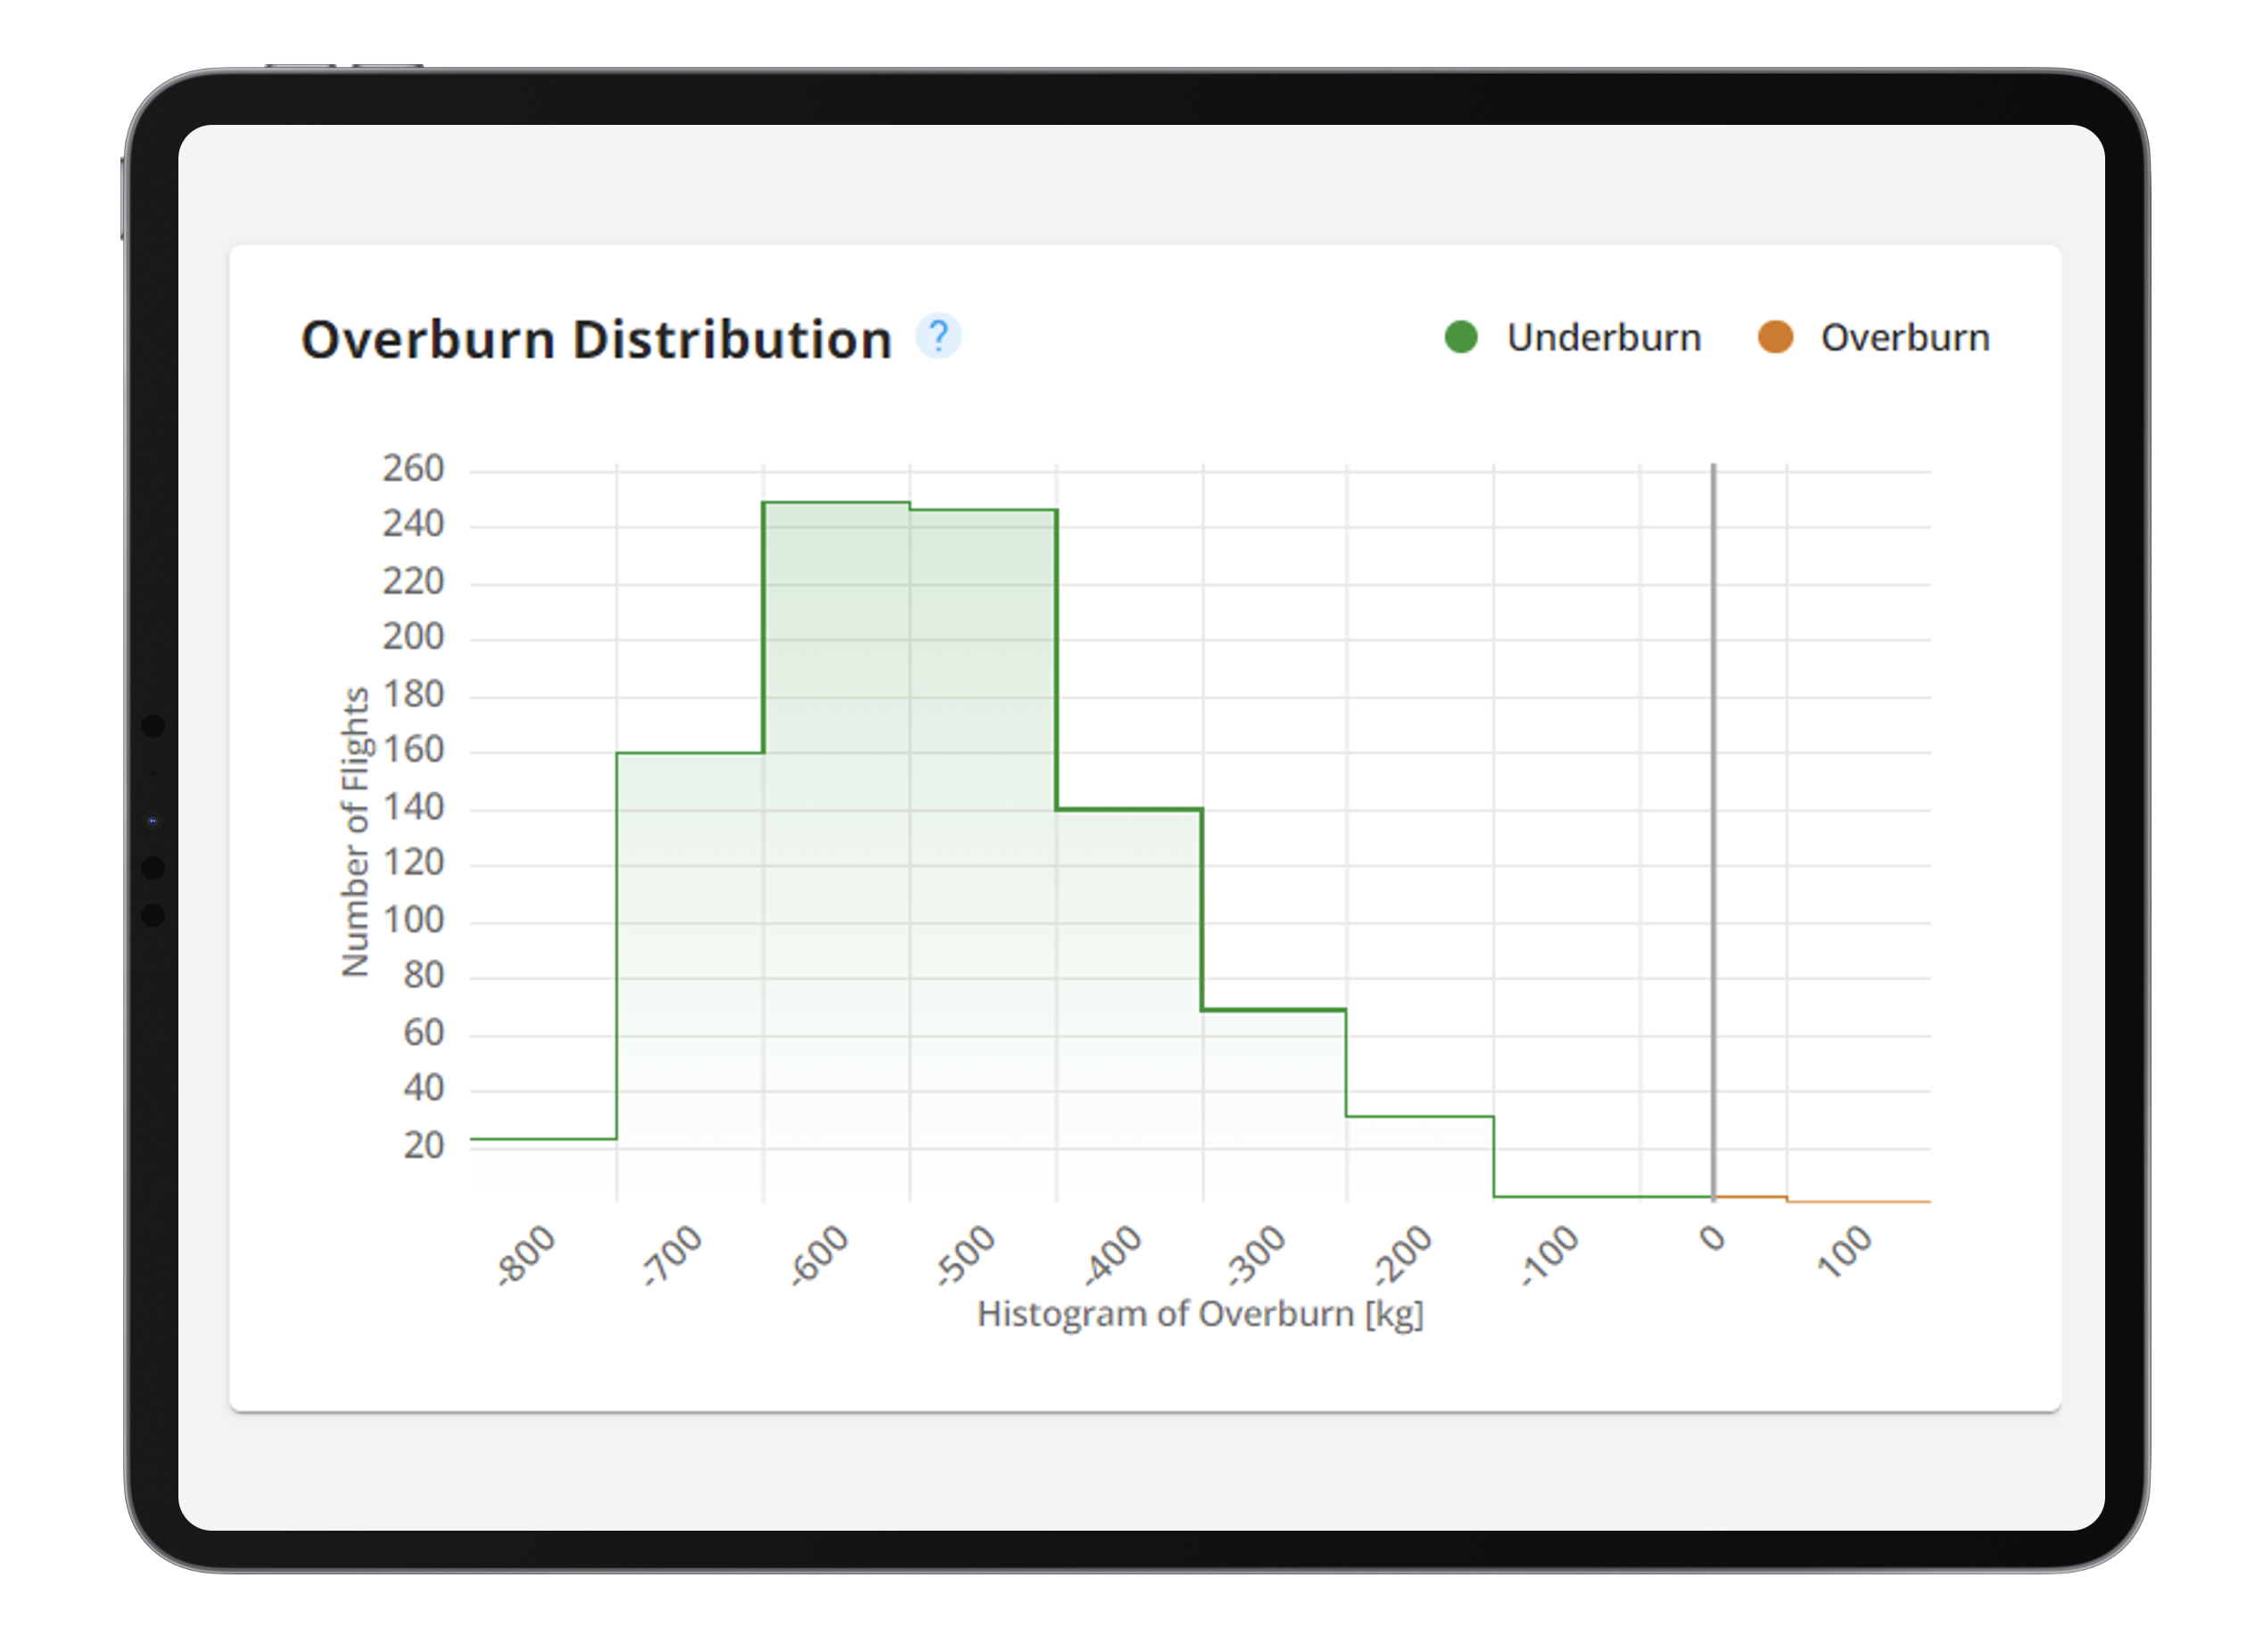
Figure 6.2
Volotea operates to about 400 different airports and has a lot of seasonal pilots, which makes it common for a pilot to fly into an airport where they have not been before. They might not know whether to expect a delay or unusual conditions, and the Fuel Briefing will prove useful in such cases. Based on the given example and presented histogram illustrating the historical distribution of fuel overburn, even if flying to an unknown destination, the pilot can see that, on this route, the usual fuel consumption is less than planned — in this specific case on most of the flights the aircraft burned 500 or 600 kg of fuel less than planned. Consequently, the pilot will decide not to carry any discretionary fuel ‘just in case’. All in all, this specific use case shows that the Fuel Briefing function might enhance the decision-making process to maintain a good balance between safety and efficiency.
The second example, especially helpful in terms of flight management in the descent phase, is shown in figure 6.3, which presents planned and actual, historical flight paths on western arrival to Rome Fiumicino (FCO).
FLYGUIDE FUEL BRIEFING USE CASE – SHORTCUT PROBABILITY
- Useful to understand conditions on arrival and approach phase at new or unfamiliar airports to prepare for an upcoming flight.
- Review historical data regarding descent flight paths on arrival to specific airport to enhance flight and aircraft energy management along with approach briefings.
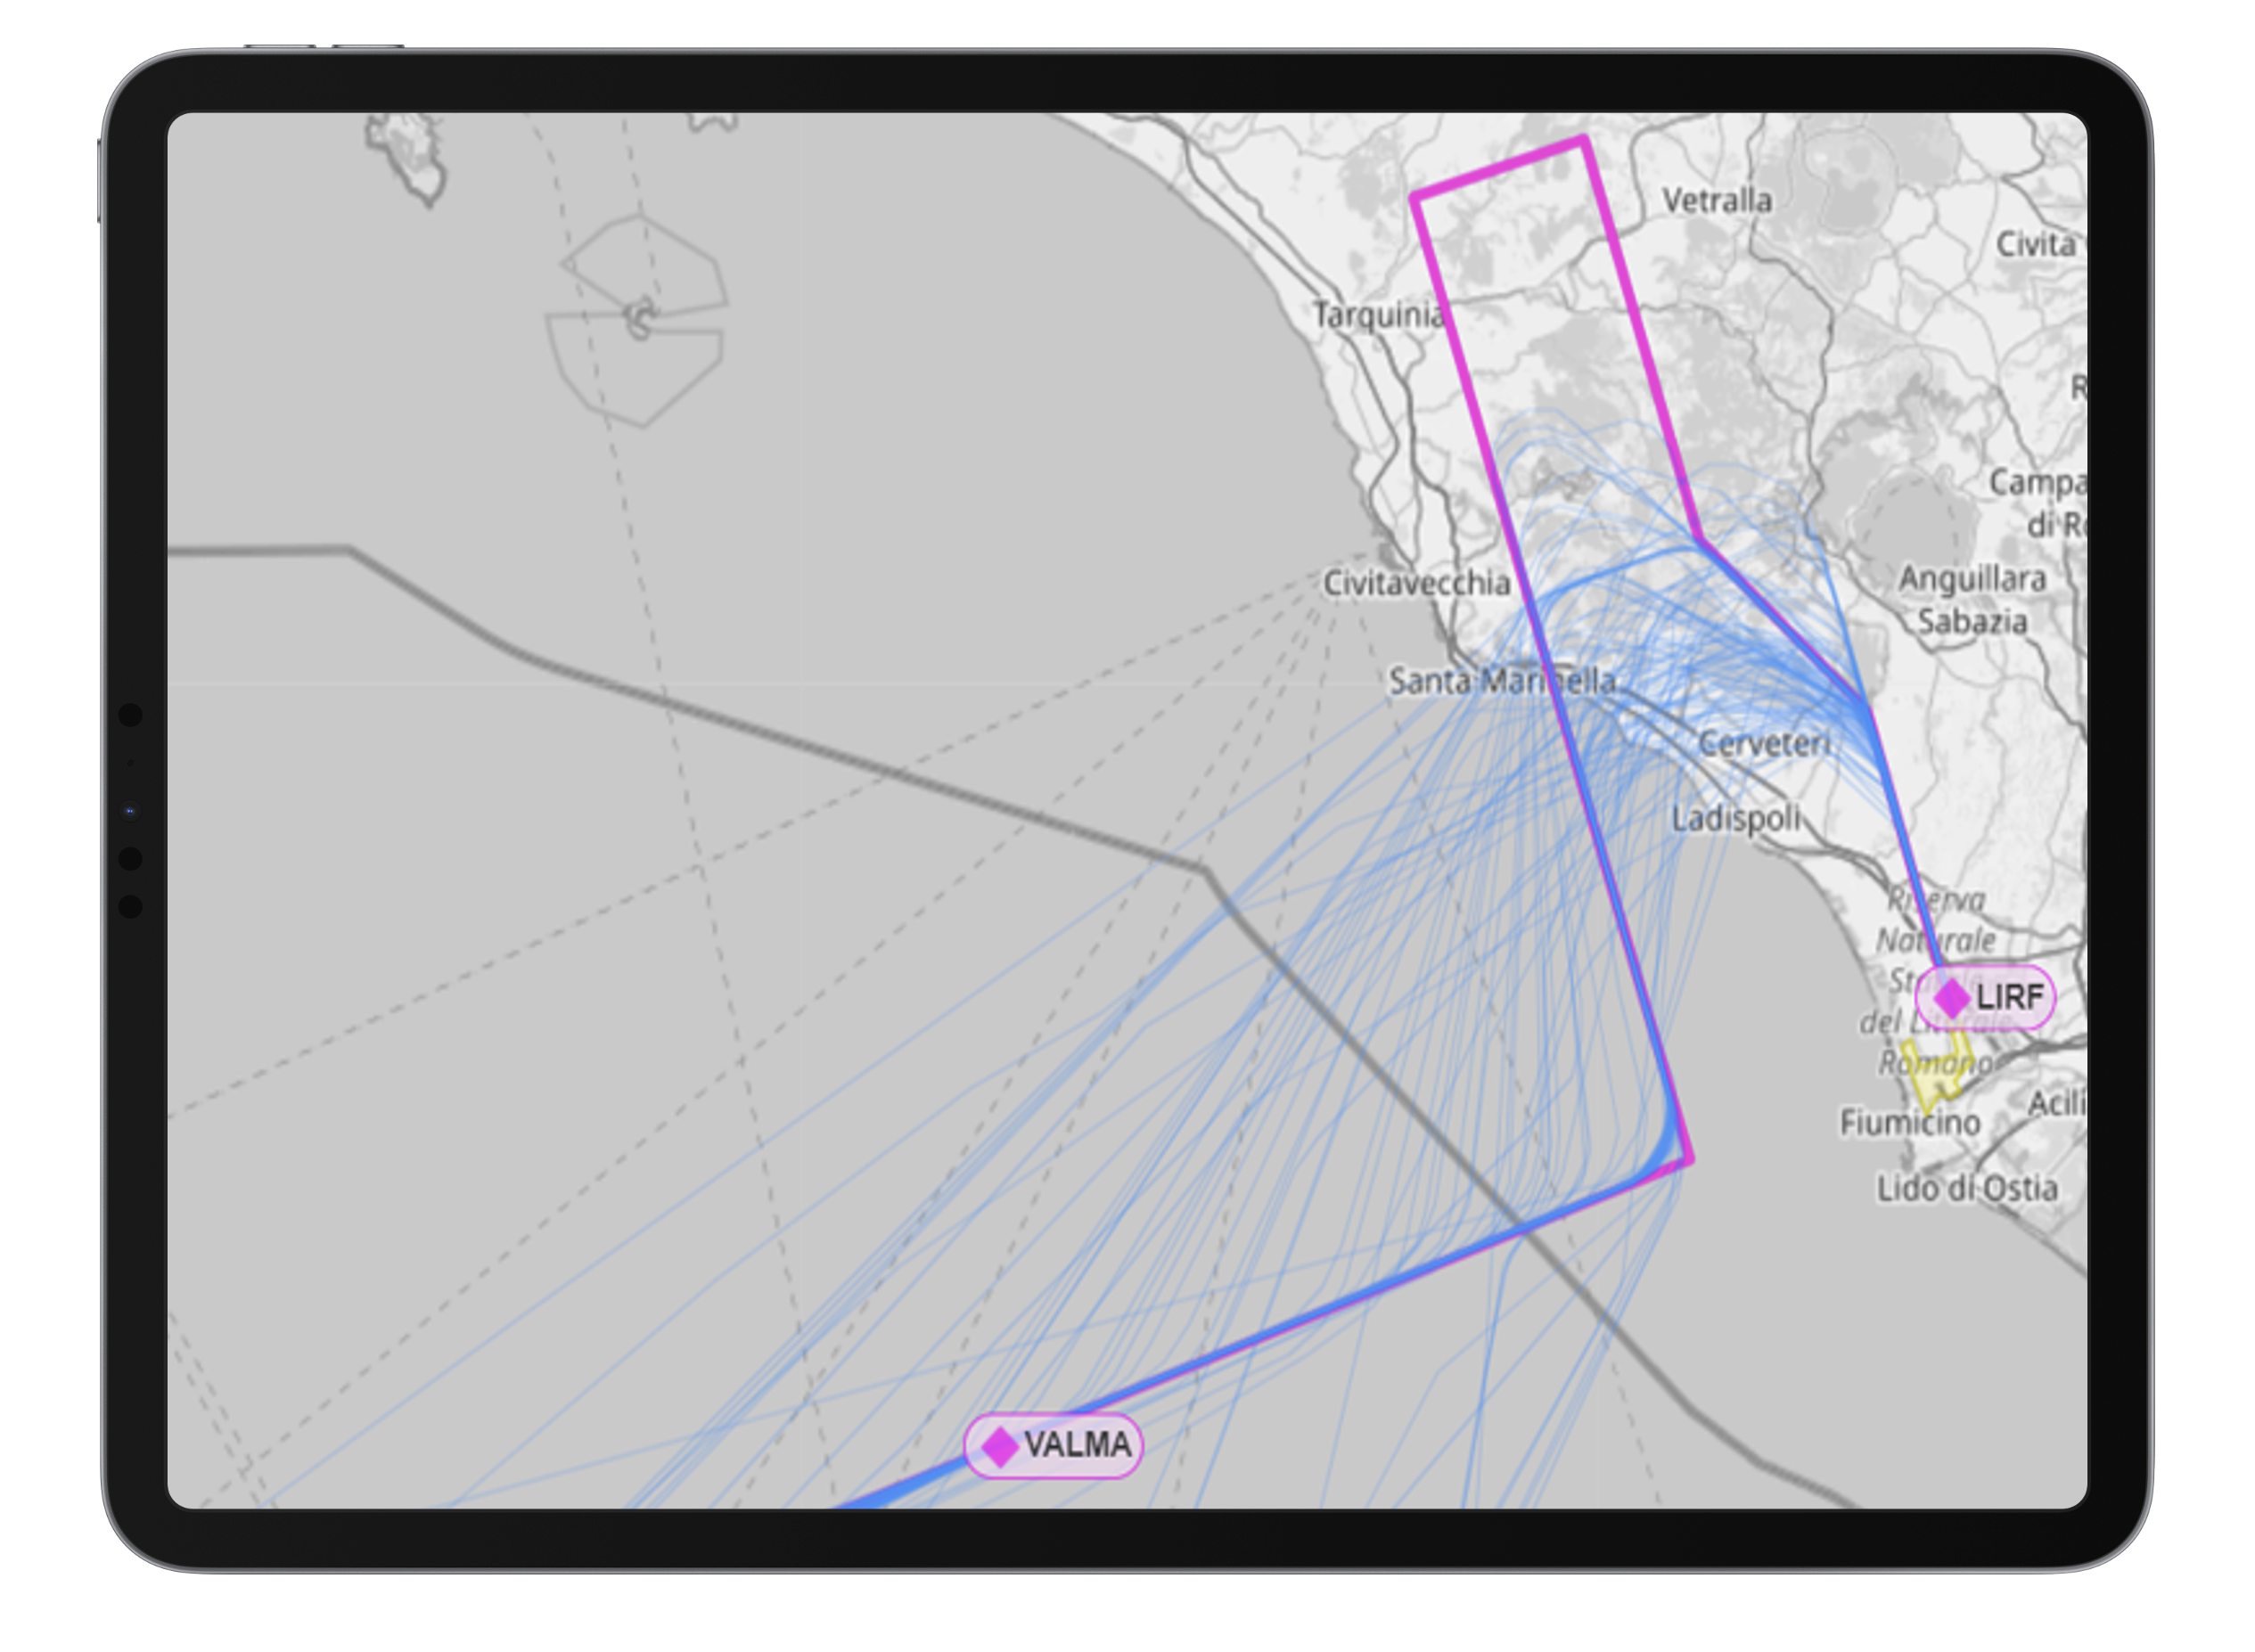
Figure 6.3
Flight and energy management in the descent phase, in order to achieve the most efficient vertical flight path and perform continuous descent, may be very challenging. It depends on many factors, including the air traffic situation in the airspace around the airport, as well as the unpredictability of the flight path. Very often, pilots cannot be sure, if or at which point of arrival they might get a shortcut. The total distance of the arrival path included in the flight plan may vary significantly in comparison with the actual descent flight path, resulting from the shortcut given by the Air Traffic Control. In the given example, on arrival to FCO, the difference in distance between the flight path included in the flight plan and the historical actual path reaches 30 nautical miles. This means that, in the case of programming the FMS for the descent flight path included in the flight plan, after getting that specific shortcut, the aircraft may end up as high as 10,000 ft on approach. This would lead to delaying vectors and consequently burning more fuel. Fuel Briefing in FlyGuide helps the pilots to enhance flight and aircraft energy management, as well as improve overall predictability of the situation on arrival to specific airports — also the ones with which the pilot is unfamiliar.
PERFORMANCE CHECK AFTER THE FLIGHT
StorkJet’s FlyGuide not only assists pilots in flight preparations but also provides them with detailed and reliable feedback in terms of their own performance during various phases of specific flights.
FLYGUIDE – FEEDBACK AFTER FLIGHT
- Provides with detailed feedback and shows individual performance of every pilot in various phases of flight and initiatives.
- Gives tips to improve compliance.
- Enhances pilots’ informed operational decision making.
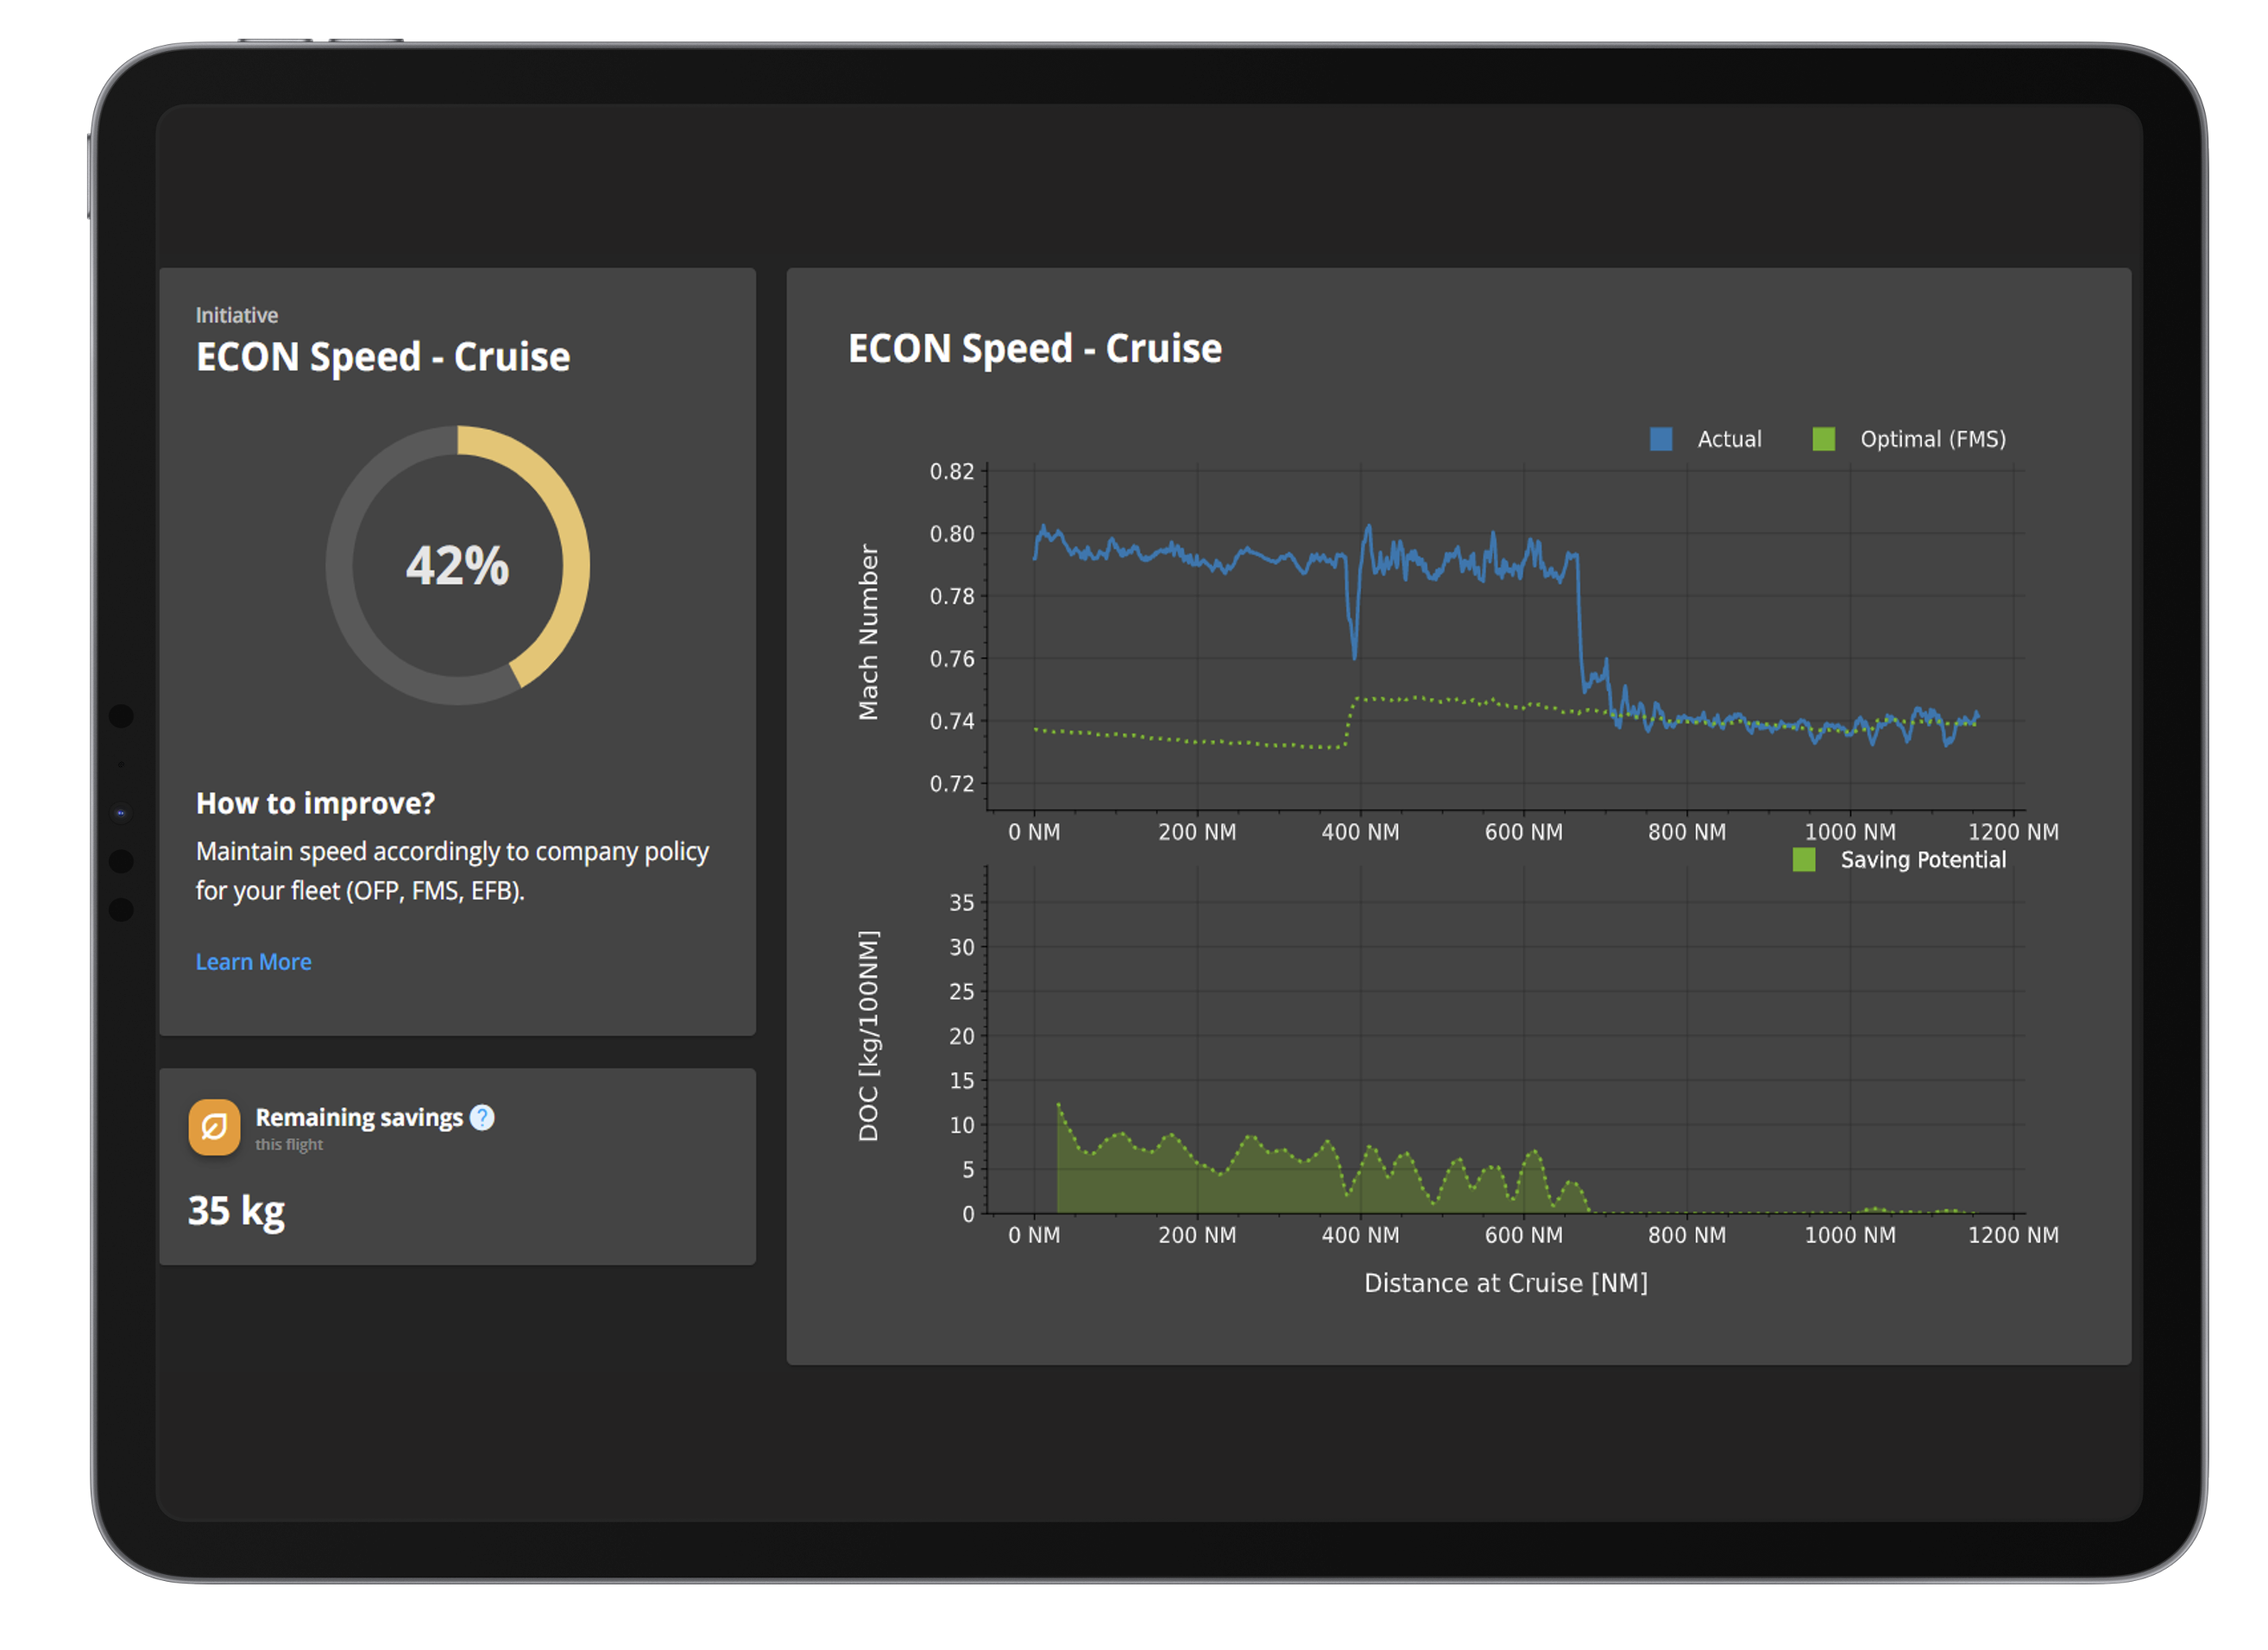
Figure 6.4
The example is shown in figure 6.4. The section illustrates the performance of a specific pilot on a particular flight in terms of ECON Speed on Cruise. As visible on the first chart, the pilot can see a detailed analysis of actual speed, he or she maintained during cruise phase and how much it deviated from the optimal value, calculated by the FMS. All the deviations are reflected on the second chart as saving potential in specific sections. Additionally, an exact value of generated loss due to deviations from optimal parameters is shown for each initiative. In the given example, due to maintaining non-optimal cruise speed in the first half of the flight, the pilot generated a loss of 35 kg of fuel. In summary, FlyGuide’s post-flight feature empowers the pilots with a comprehensive understanding of each flight phase in terms of fuel efficiency. It not only pinpoints the exact moments and reasons behind any fuel consumption deviations but also showcases the potential for further improvement. The magnitude of fuel penalties transforms into opportunities for optimization, paving the way for more efficient and sustainable flights. Moreover, the post-flight feature enhances pilots’ informed decision-making for future flights.
CONTRIBUTOR’S DETAILS

JUHA ARAMO
Juha joined Volotea as a captain in 2012 when the company started to fly. He has been Volotea’s Director of Flight Operations for the last seven years. Juha started his aviation career in 1980 in the Finnish airforce flying different types of jets, passing in 1997 to the civil side of aviation. Since then, his primary type has been Airbus 320, first with Spanair and lately with Volotea.

JUHA KULMALA
While at Volotea, Juha was involved in projects such as EFB, Flight Planning System, Fuel and cost efficiency and more. Juha started his airline career in Blue1 as a first officer on Avro RJ and had a key role in EFB implementation, fuel efficiency, introduction of new aircraft fleets, producing Operations Manuals and MEL.

Volotea is one of the fastest-growing independent airlines in Europe, with bases in 19 medium-sized European capitals and operations that reach more than 100 airports with its fleet of 41 Airbus A319 and A320. The airline is dedicated to sustainable aviation and has committed to reducing 50% of its 2012 CO2 emissions per passenger kilometer by 2030. To date, Volotea has launched over 50 sustainability initiatives that have driven a 40% reduction in carbon footprint per passenger kilometer. Since 2022, the company has been working on developing emission-free alternative technologies, operating Airbus’ internal shuttle service with 34% of sustainable aviation fuel, and collaborating with manufacturers and the industry so that these fuels can be developed and become widespread as soon as possible.
